Ready to use IBM Apptio software in new ways?
Apptio software is widely known for providing financial transparency that optimizes IT costs and aligns IT spend with business objectives. But did you know… Apptio can be used for so much more?
We’ll reveal five inspiring stories that demonstrate how Apptio software has empowered leaders to:
As you explore these real-life scenarios, consider how your organization can benefit.
→ Check out the 10 Benefits of Apptio Software for Your Organization section below!
Problem
A global company with a strong focus on sustainability set a goal to achieve net zero greenhouse gas emissions by 2050. At the start, they had 40 data centers and 200 offices that contributed 30% of their overall emissions. To meet their goal, the company needed a reliable way to track, measure, and reduce these emissions.
Innovative Apptio Software Utilization
The company now creatively uses Apptio software to track carbon emissions and make sustainable infrastructure decisions. By treating emissions as a measurable “currency,” much like financial costs, they can track emissions across their IT infrastructure.
- This includes service layer and product layer emissions for physical and virtual servers, mainframes, storage, and network devices.
- Servers (physical and virtual machine), mainframes, storage, and network devices are captured and used to measure emissions by business unit, leader, and product.
- The company integrates third-party data to assign emission values to each piece of equipment. This third-party data is sourced from providers that consider emission factors, kilowatts used, and electric costs to create a consistent baseline for measurement.
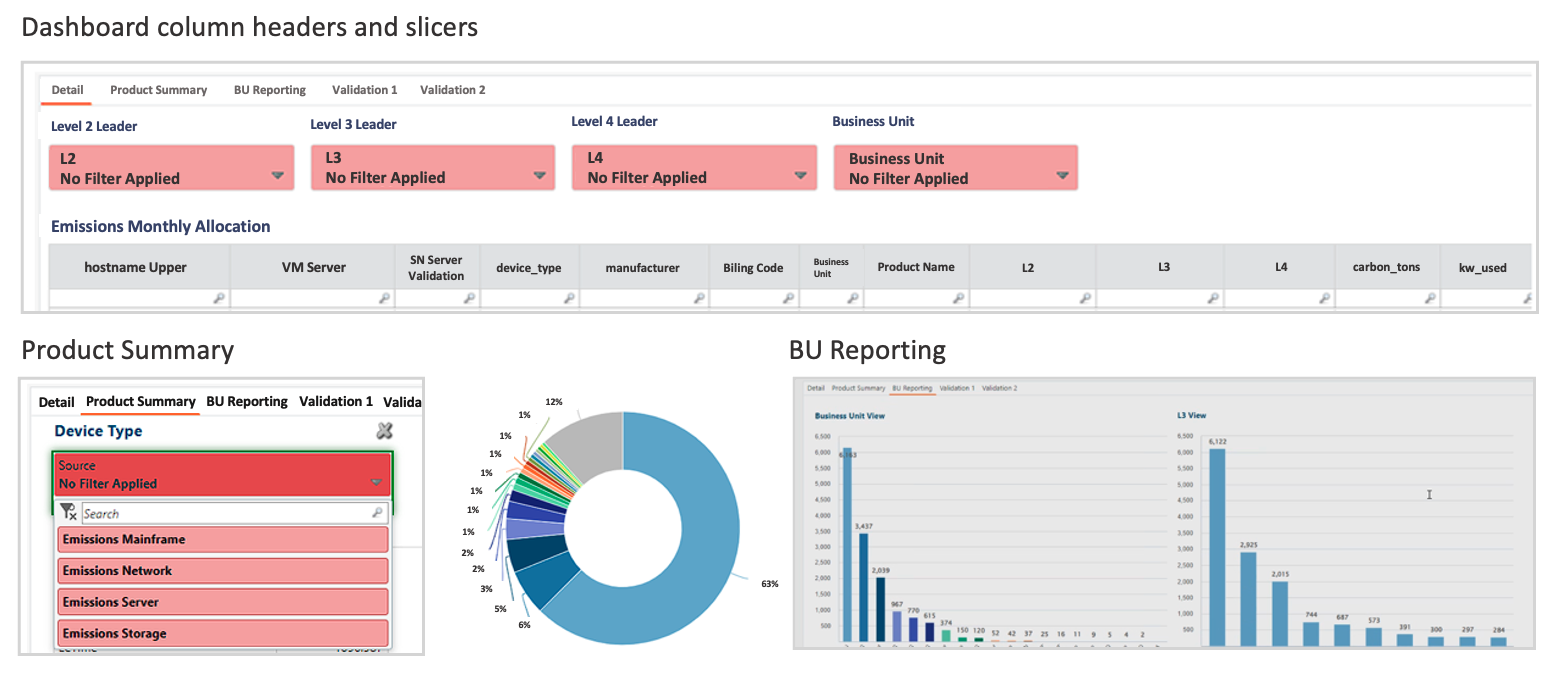
Carbon Footprint Dashboard
Key Outcomes

Apptio software equips the company to efficiently measure, track, and predict emissions, helping them set a clear path toward achieving their net zero goal.
- Apptio’s analysis provides a comparative Objective and Key Results (OKR) report, empowering the company to evaluate multiple data points simultaneously and make data-backed decisions that align with both environmental goals and financial efficiency.
- The month-over-month trend report is extremely valuable, as the company can easily visualize and track consumption goals against actuals. By analyzing the top 10 devices contributing to emissions, they gain valuable insights into trends. Utilizing that data, they can adjust and reduce energy consumption in their data centers.
- Apptio’s model equips the company to apportion carbon emissions between business units, leaders, and products, providing detailed showback reporting. This enables business leaders to see their own team’s contributions to the company’s overall emissions, promoting accountability and informed decision making.
- The company also plans to use Apptio’s “what-if” scenario analysis to compare the impact of various actions. For example, they can compare the financial and environmental impact of specific vendor’s products and models. Armed with this information before making purchases, they will minimize cost and optimize outcome.
Want help setting up something similar? Contact us! We are happy to help!
Problem
An organization needed a way to streamline vendor management and reduce overall costs.
Tracking vendor spend is often cumbersome and confusing for cost center owners, asset managers, and service owners. Managing contracts, non-contract expenses, and purchase orders (POs) from the same vendor without a clear understanding of cost origin can lead to excessive spending, inefficiencies, and missed opportunities for better negotiations.
Innovative Apptio Software Utilization
Now, the organization brilliantly utilizes a vendor spend dashboard in Apptio that consolidates essential vendor information into a comprehensive view. Apptio software provides a one-stop-shop for wholistic and detailed views of valuable OKR metrics, including vendor spend, trends, and commitments.
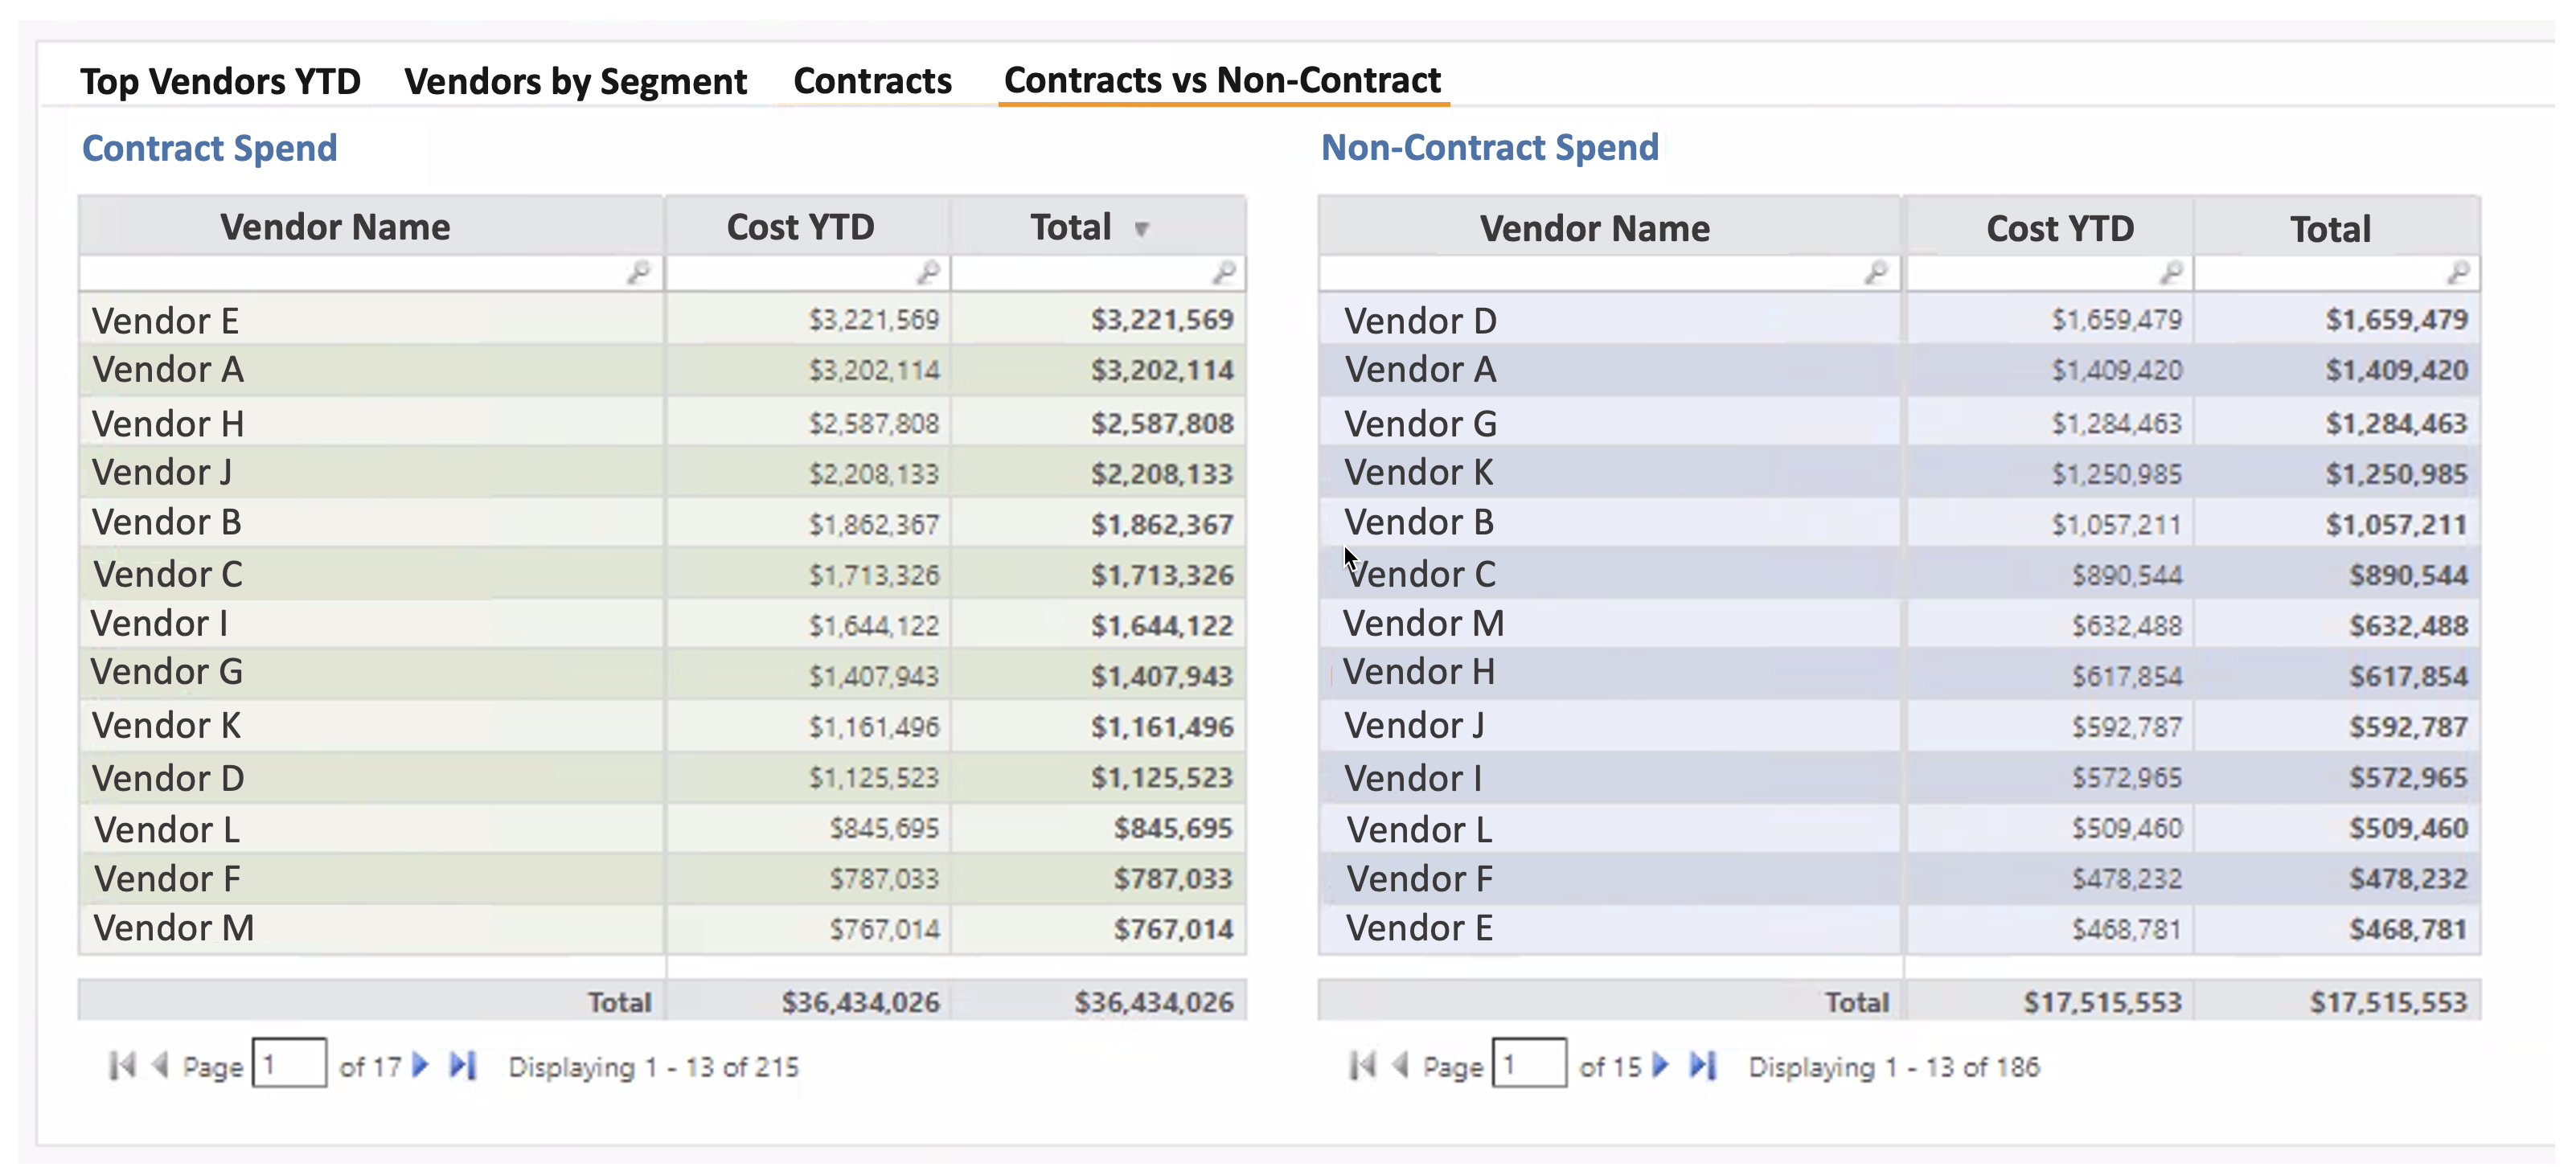
One of the key differences of this custom dashboard, compared to out-of-the-box vendor spend reports, is the ability to compare contract spend – versus non-contract spend – for the same vendor.
The Apptio vendor dashboard has three main functions.
Additionally, the vendor spend dashboard provides valuable insights:
Vendor Dashboard
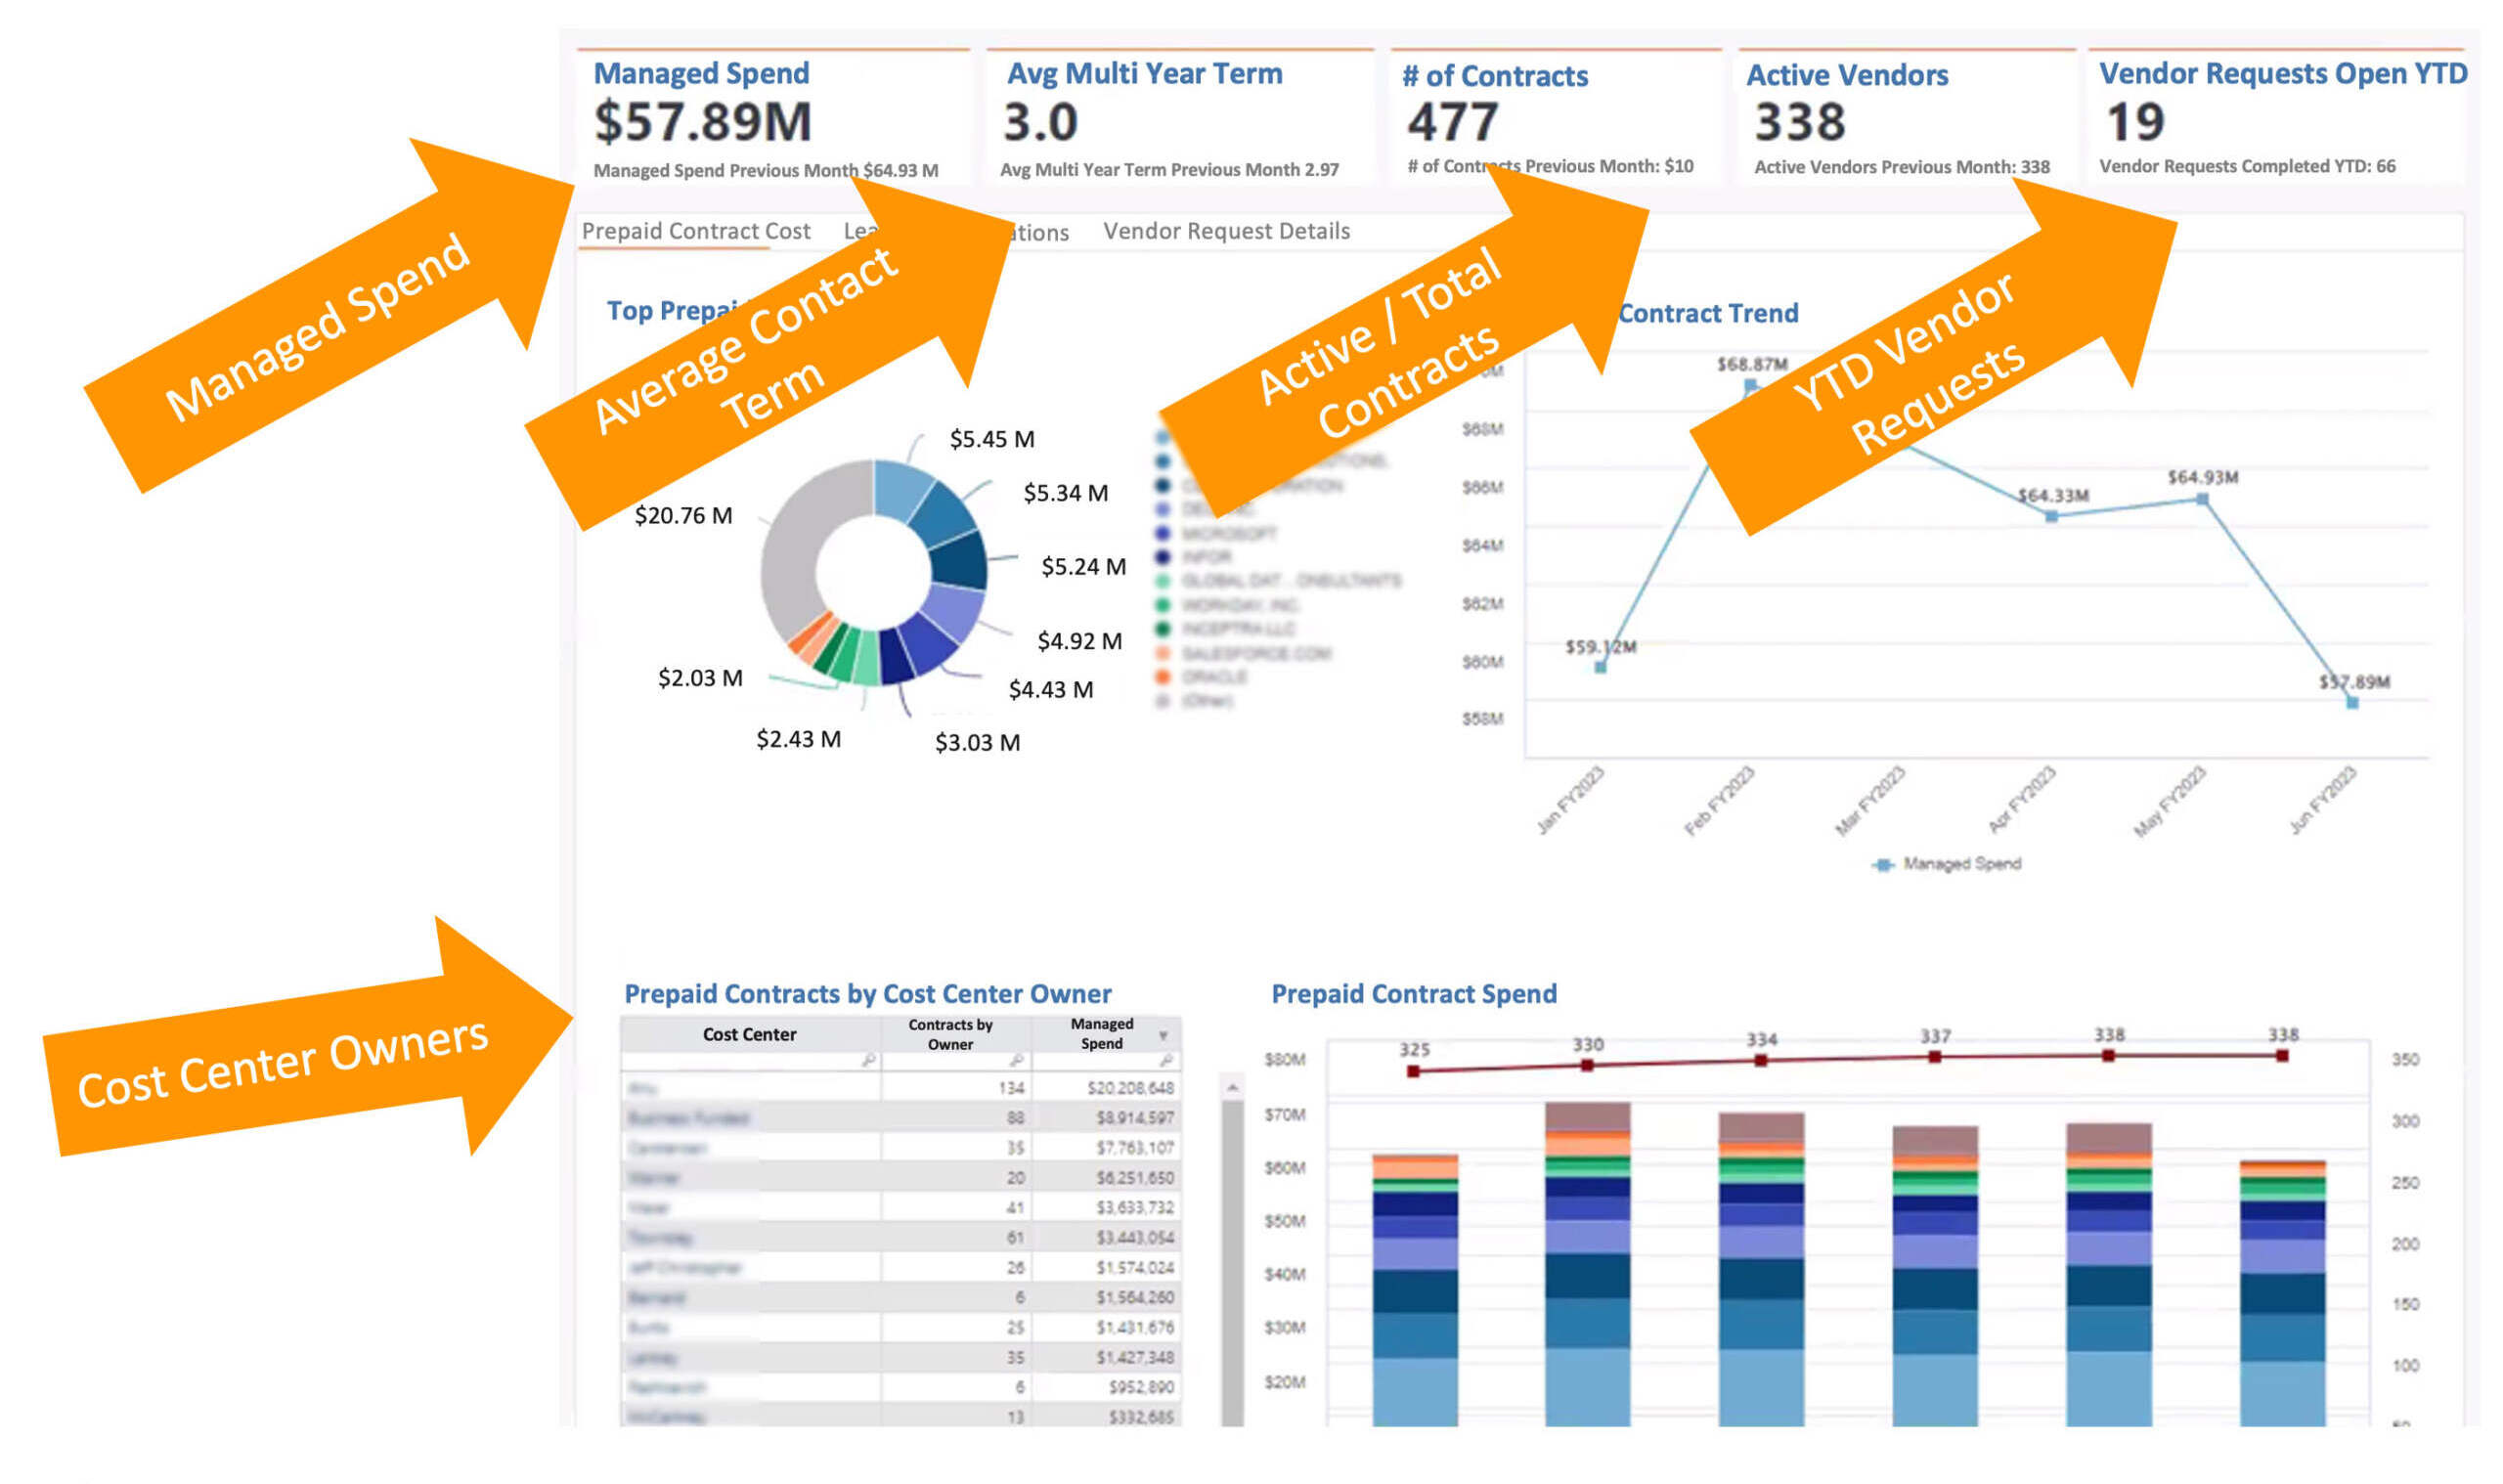
Additional tabs in the report include Lease Details and Contracts Due This Year.
Contract vs. Non-Contract Spend Report
This report depicts a comparison between Contract and Non-Contract cost, sorted by total spend.
Key Outcomes

- The ability to compare contract spend – versus non-contract spend – for the same vendor enables the organization to reduce the overall cost obligation to vendors by transitioning one-off POs into longer-term contracts.
- This contributes to significant savings!
- Apptio’s vendor dashboard provides comprehensive data that equips cost center owners, asset managers, and the procurement team to evaluate vendor and contract details, including new vendor requests, rationalize existing vendor contracts, and improve spending forecasts.
- This further streamlines their vendor ecosystem and saves money.
- Additionally, Apptio’s vendor dashboard provides cost center owners and asset managers with transparent real-time data. This empowers them to:
- Effectively make data-based decisions.
- Drive strategic vendor negotiations with proactive adjustments to spending strategies, optimizing vendor relationships and cost control.
- Engage more proactively with procurement teams and other departments.
- Increase internal accountability and help owners manage their budgets with precision.
Want to achieve similar results? Contact us today, and let’s get started!
Problem
A software development company needed to track and ensure compliance with Systems Development Life Cycle (SDLC). SDLC is a framework that defines tasks performed at each step in the software development process.
Tracking compliance of SDLC to meet regulatory and audit requirements can involve complex communications, manual tracking, and redundant reporting efforts. Additionally, the company was experiencing a lack of visibility into project compliance points, status reporting, risks, and issues. They needed to streamline SDLC compliance reporting and improve overall reporting with senior leaders for better decision-making across teams.
Innovative Apptio Software Utilization
The organization now skillfully employs the powerful reporting of Apptio software to create combined compliance and project management visibility and reporting by integrating Clarity project management data into Apptio.
The integration of Clarity data into Apptio software is fully automated. Nightly data loads from Clarity are pushed into Apptio via Datalink, ensuring near real-time reporting and up-to-date information for all stakeholders.
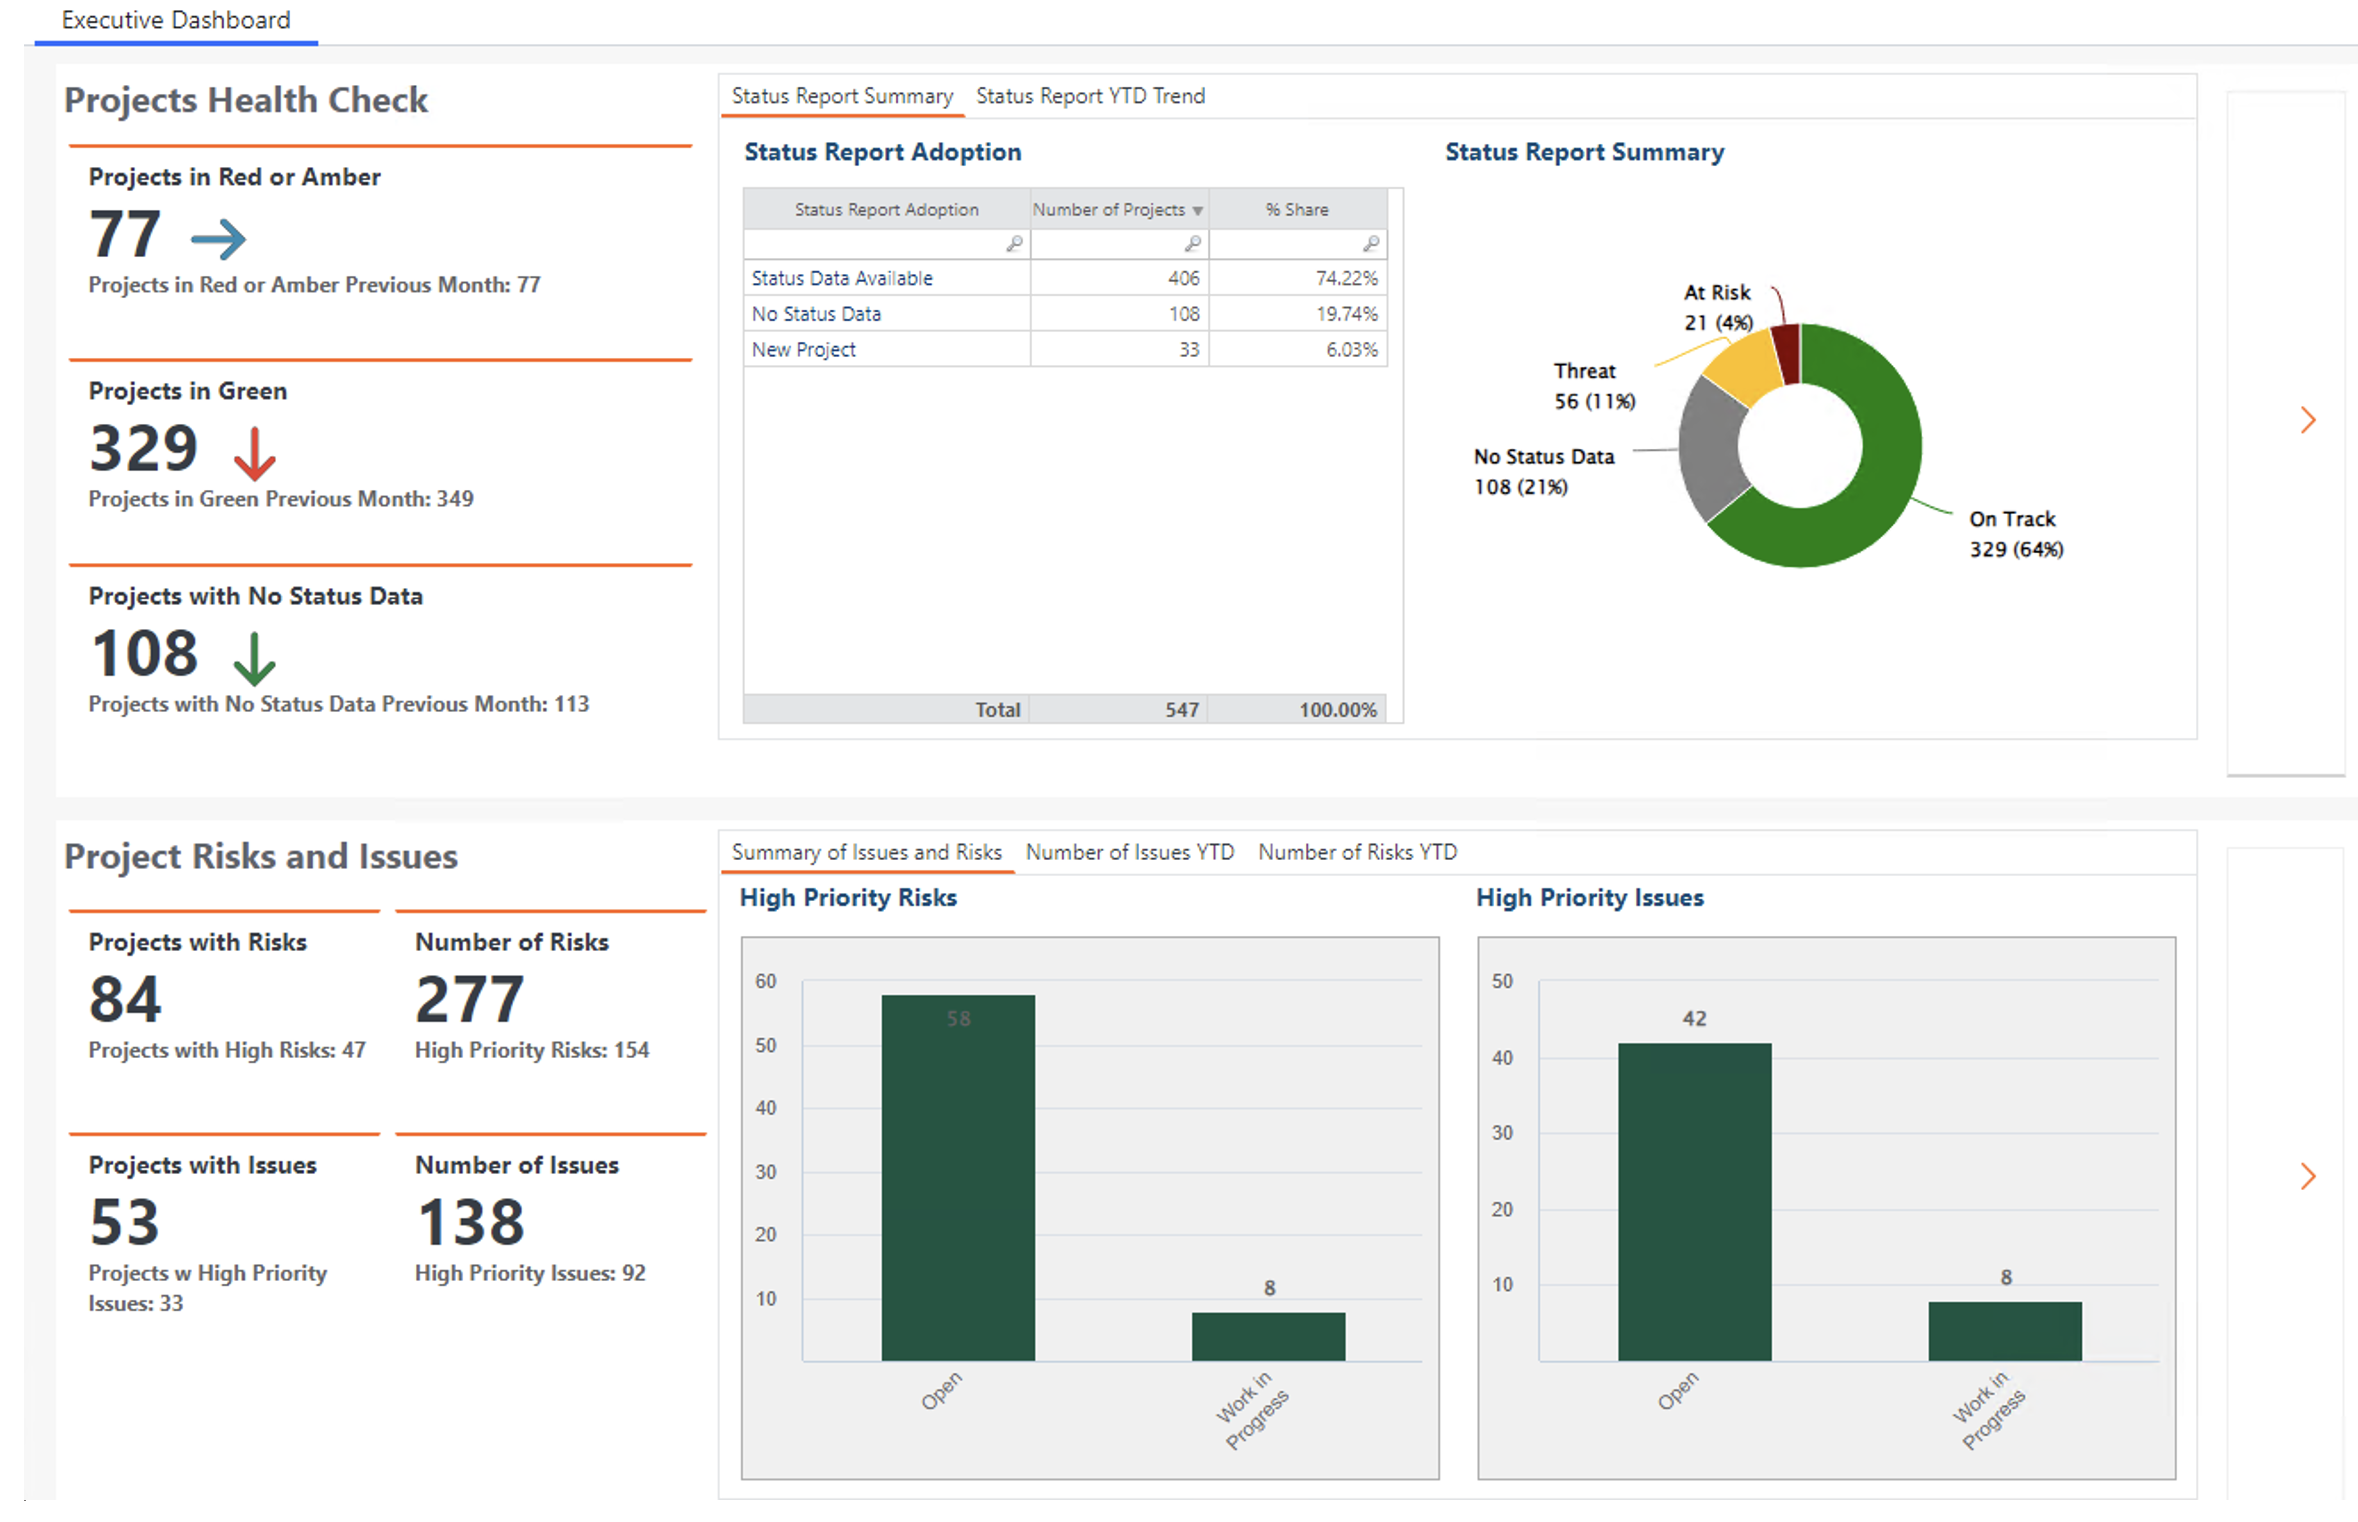
Compliance Tracking Dashboard
Key Outcomes

- The company achieved and maintains SDLC regulatory and audit compliance! The integrated data provides the company with the visibility to swiftly identify projects that are out of compliance. The data also confirms where compliance data is accurate, complete, and readily available for audits. Missing or poor quality data is surfaced and can be fixed at the source.
- By automating SDLC compliance reporting through Apptio software, they eliminated manual reporting efforts! Apptio’s automated reporting replaced labor-intensive manual reporting processes, allowing teams to focus on high-value tasks rather than redundant reporting. This shift increased efficiency and reduced the potential for human error in compliance tracking.
- The organization now benefits from enhanced communication between internal stakeholders. The integration of Clarity data into Apptio provided the compliance team, executives, and other key stakeholders with relevant, up-to-date information. Aligned with synchronized information, departments communicate and collaborate frequently.
- The centralized dashboard of Apptio software empowers informed decision making. The robust reporting capabilities provide executives with key metrics and insights into project compliance and health. It identifies risks, issues, and bottlenecks at each project phase gate. This visibility equips executives to explore project details within their portfolio, identify areas of concern, and make timely, data-driven decisions.
Ready to implement a similar solution? Get in touch – we’re here to help!
Problem
The leaders of a business understood that each of their projects was a significant investment. To maximize their ROI, they needed to prioritize projects that produced the most value in the least amount of time.
To make informed decisions, they needed to clearly identify each project’s speed and generated value – including hard savings (financial gains) and soft savings (efficiency improvements). They wanted to compare projects and determine where to invest their resources for the best outcome.
Creative Apptio Software Utilization
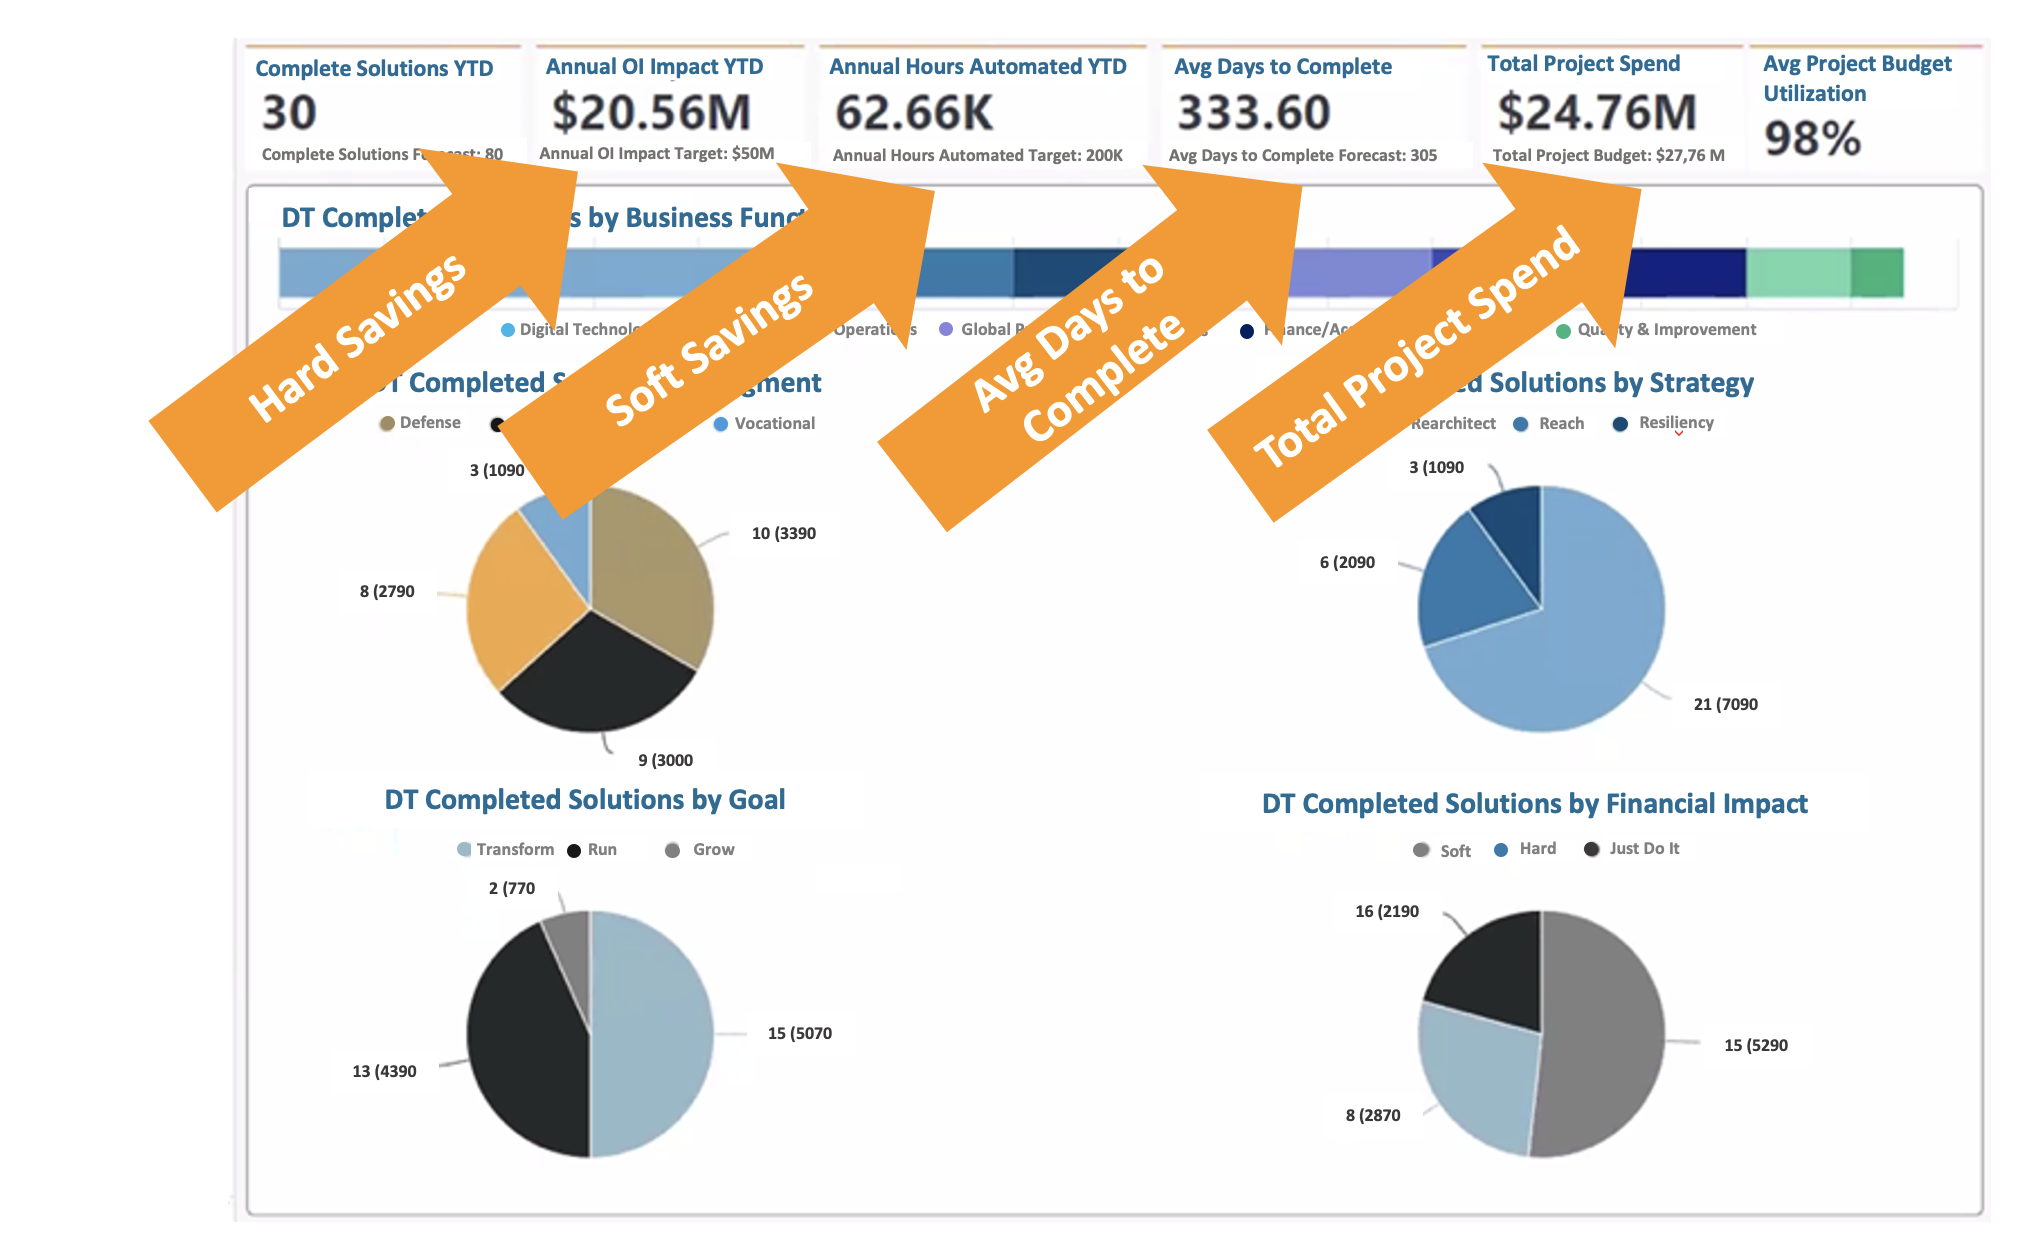
Now, the business innovatively utilizes Apptio’s Time to Value Dashboards that analyze project time and budget. Unlike other project management tools, Apptio can cross-reference project time to project value, creating a true ROI model.
Apptio’s dashboards track project speed from start to finish. The calculations include the value generated by projects in terms of hard and soft savings. It provides the expected true value of the project, as it balances the costs during the first year and also over the next five years. (Often the operational cost of a project depreciates over time, while the value increases.) Apptio’s calculations account for these trends.
Apptio’s dashboards offer a centralized view of critical metrics, including:
Apptio’s dashboards also provide a variety of useful data views, including:
Categorical data of completed solutions are easily visualized in pie charts that depict:
Apptio Software: Time to Value Dashboards
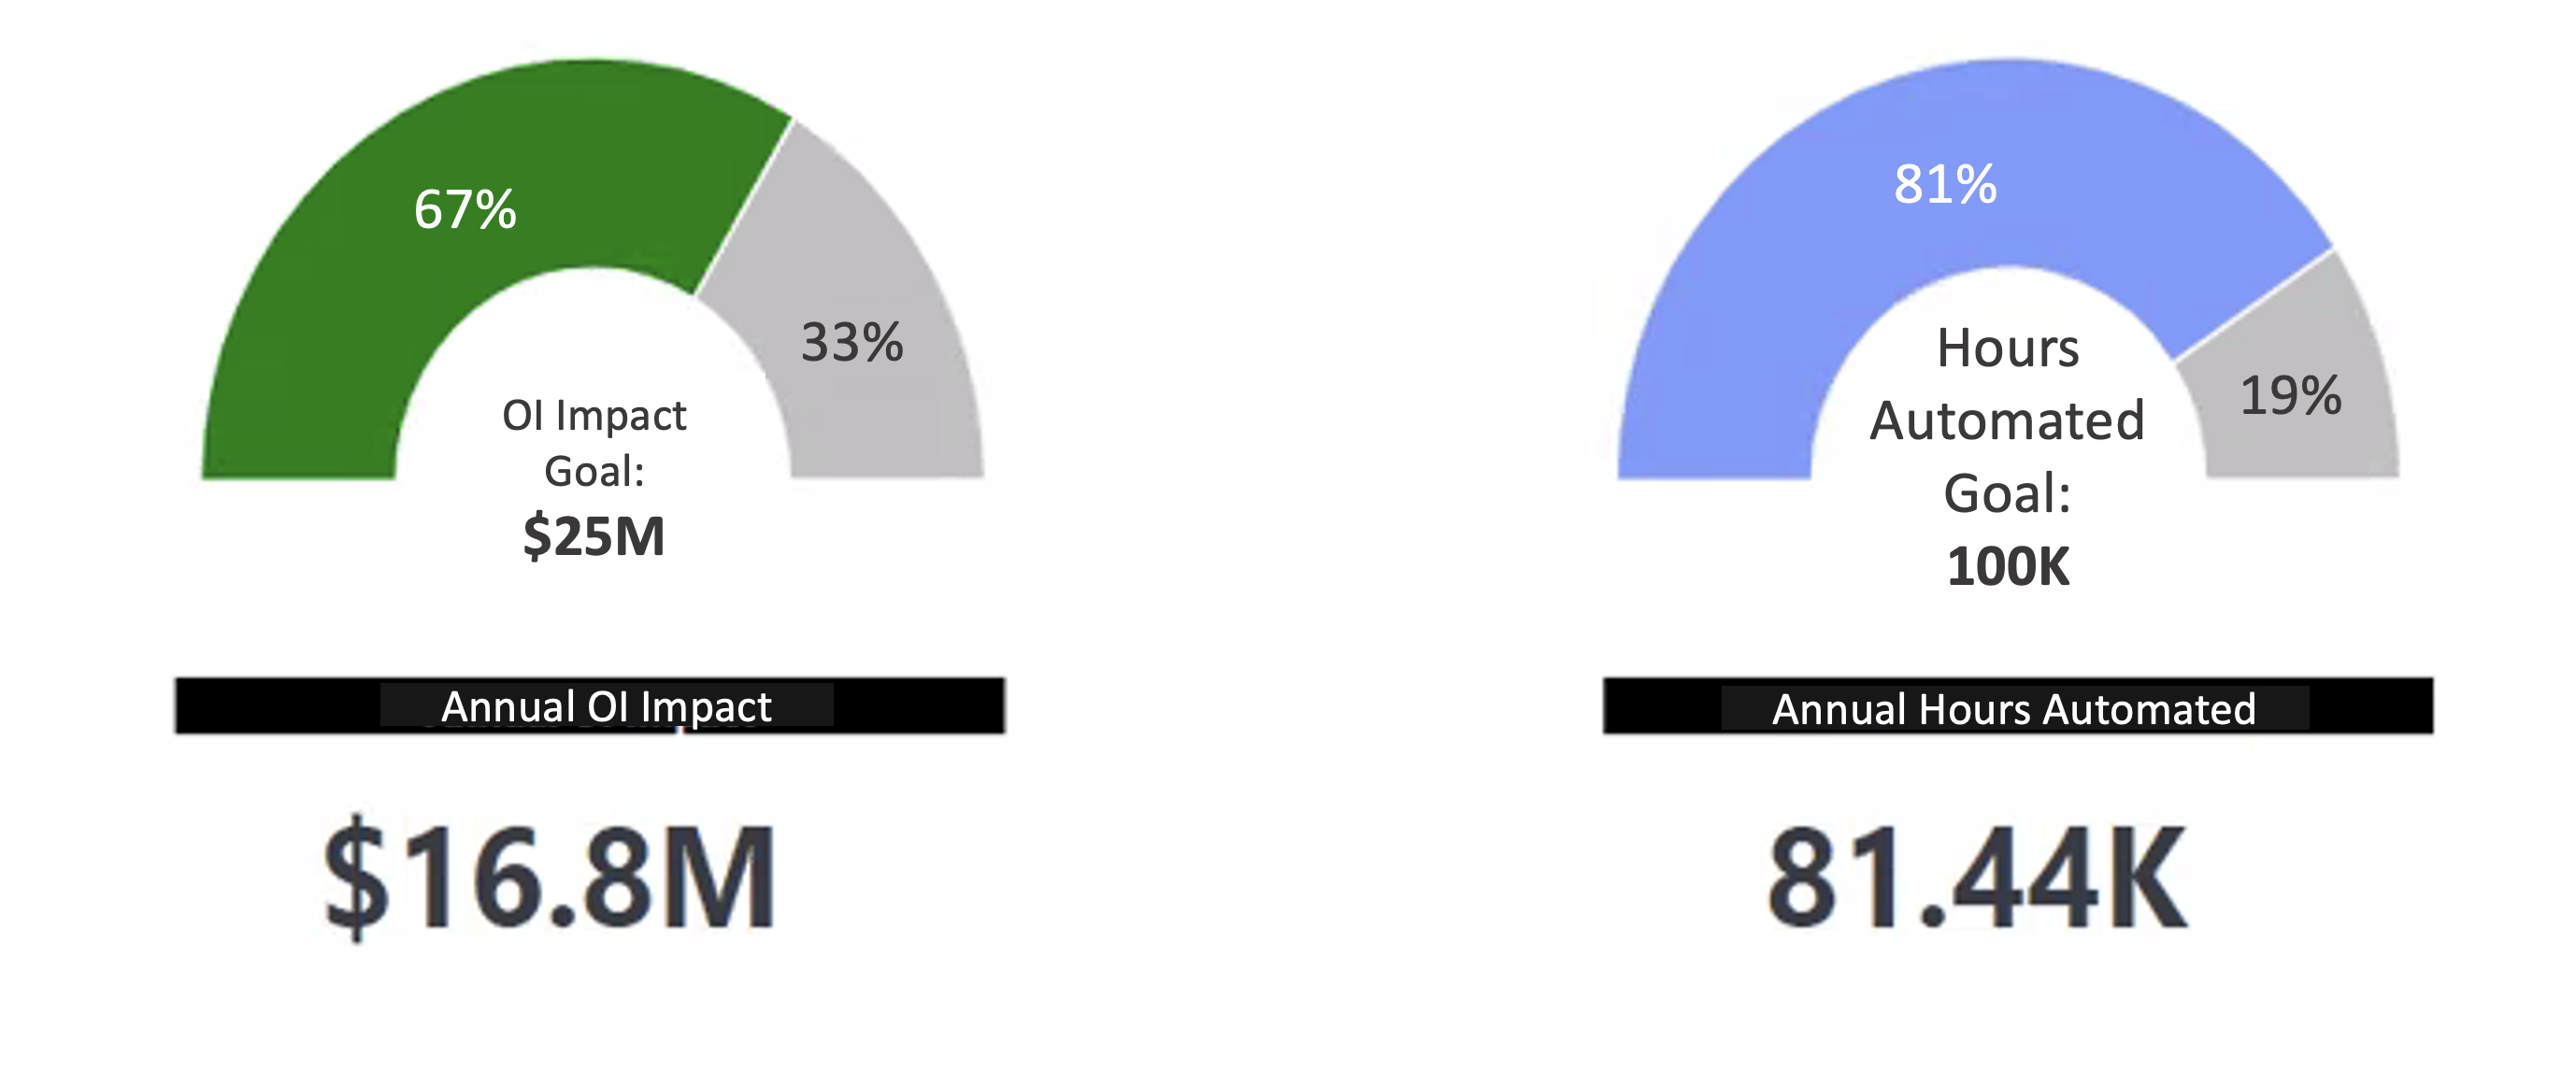
The business also utilizes gauge charts within the Apptio software to clearly visualize hard and soft savings, compared to the goals of the business.
Solutions & Projects
Hard savings measurements and automated hours tracked using software
Key Outcomes

- Apptio’s customizable dashboards quickly and clearly communicate key information throughout the organization, igniting insights, such as how to allocate resources to the highest-value projects. This additionally increases efficiency, as resources are able to streamline their time and efforts.
- Apptio software stands alone in its ability to cross-reference both project time and project value, creating a true ROI model. It measures the value generated by projects in terms of hard and soft savings, and it tracks project speed from initiation to completion. It balances the cost of a project with the expected value within the first year and over the next five years.
- Apptio software provides the business leaders with a tool to easily visualize and compare projects within and across portfolios, helping them prioritize portfolios based on the actual and estimated contributions toward business goals.
- The shared visibility of Apptio’s dashboards drives better alignment and collaboration among leadership teams, further enhancing the efficiency of project management and portfolio prioritization.
Curious about implementing a setup like this? Contact us to get started!
Problem
Within a large organization, many business departments were struggling to stay within their budgets, and their central IT department was taxed with unexpected support demands and cybersecurity risks.
It became known that many departments were making IT purchases outside of the central IT budget – a practice known as Shadow IT Spend or Business Funded IT Spend. Purchases included software licenses, hardware, servers, storage, and specialized services.
These expenses were not tracked in the centralized IT budget or forecasts, which led to inaccurate budget planning for both the central IT department and the business departments.
Additionally, these ad-hoc purchases were made without the proper oversight of IT security protocols. This resulted in potential cybersecurity risks, and the frustrating challenges of technology sprawl.
The IT department was bogged down by a slew of challenges:
All of these factors contributed to reduced productivity across the organization. The IT team was slowed down by the challenges listed above. Employees were also unproductive, as they had expected flawless operation of their shiny new systems but were stymied with ineffective tools and delays.
The organization’s goal was to reduce Shadow IT Spend by providing factual and compelling data to influence the behavior of the business departments, and ultimately have all IT spend fall within the central IT budget.
Innovative Apptio Software Utilization
The company now benefits from a cleverly configured dashboard that utilizes Apptio software to identify costs that fall outside of the central IT budget. The Shadow IT Spend dashboard performs three main functions:
- Identify Shadow IT Spend on contracts and POs, by flagging specific cost centers.
- Identify assets (such as licenses, servers, storage, or services) that are purchased with Shadow IT Spend.
- Align cost to applications and reveal the added cost of Shadow IT Spend assets.
The Shadow IT Spend dashboard built with Apptio software clearly communicates the key findings of the organization’s Shadow IT Spend with monthly and year-to-date [YTD] reports. These reports included vendor contracts and purchase orders (POs).
Shadow IT Spend Dashboard
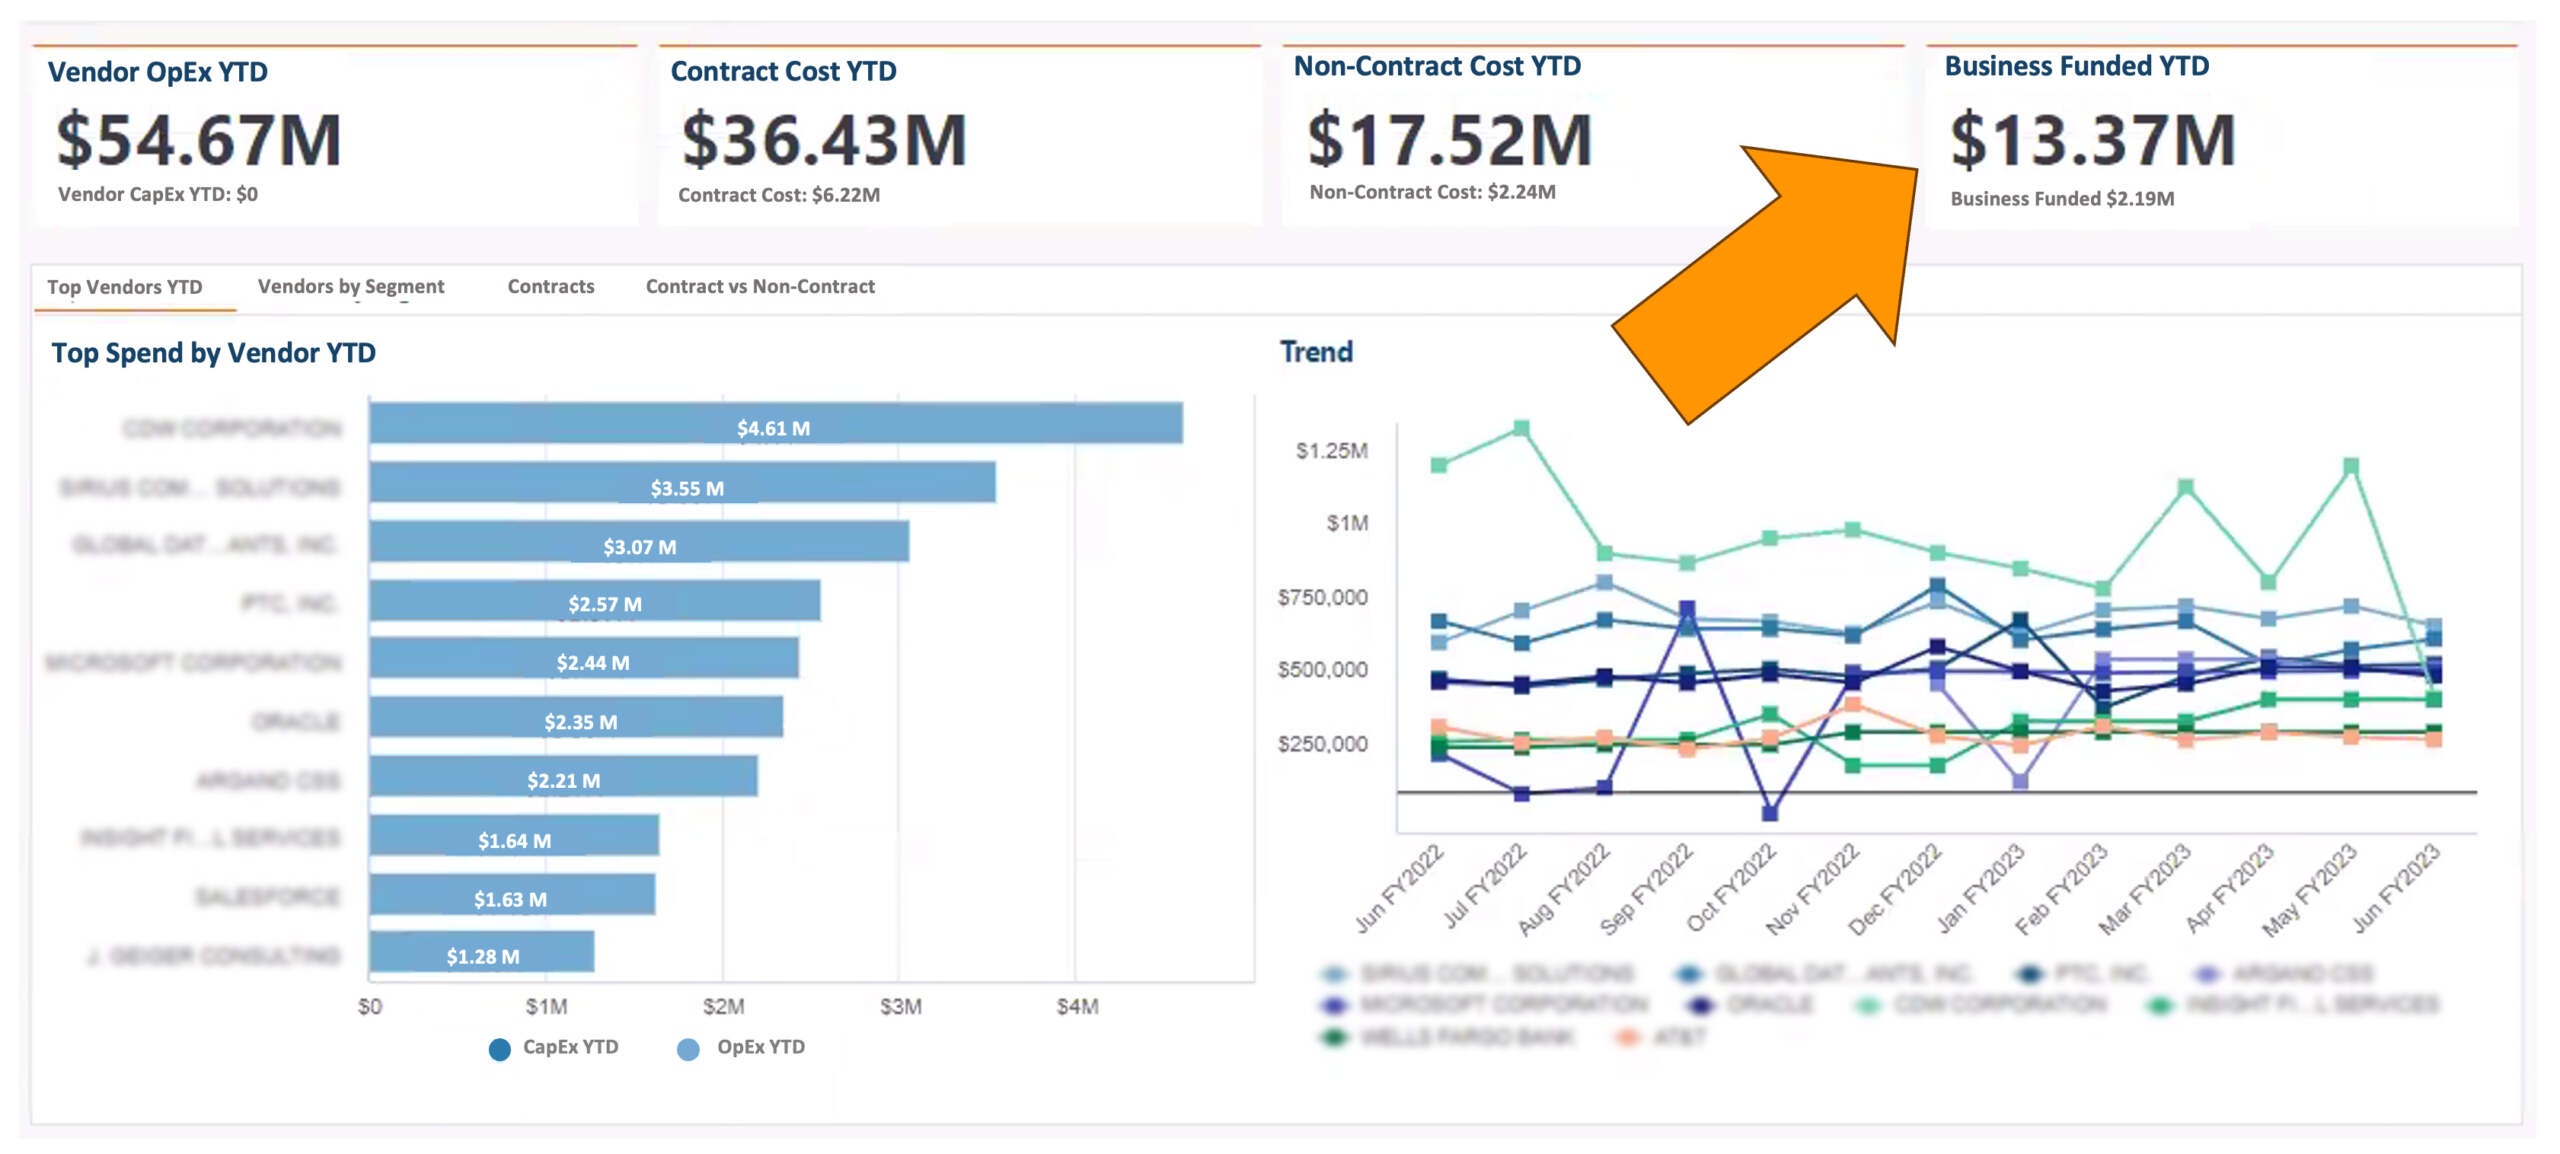
The dashboard also highlights year-over-year [YoY] spending trends for Shadow IT Spend.

Key Outcomes

- Reduces Shadow IT Spend. Customizable dashboards within Apptio keep key cost metrics front and center through monthly and year-to-date [YTD] reports. By isolating these expenses and providing clear data, Apptio software empowers leaders to track and control Shadow IT Spend.
- Increases budget forecast accuracy. With Apptio software, the organization is able to improve budget forecast accuracy by incorporating Shadow IT Spend into its overall IT budget. This provides a more complete view of IT costs and enables them to address untracked spending effectively.
- Identifies IT spending trends. The dashboard also highlights year-over-year [YoY] spending trends, giving application owners the data they needed to understand how their spending evolves and how following IT processes is financially beneficial.
- Better alignment between business units and IT. By keeping cost metrics visible, the dashboard drives greater use of Apptio and encourages increased collaboration across departments.
- Cyber-security risk is greatly reduced. Apptio’s Shadow IT Spend dashboard helps reduce cybersecurity risks by identifying purchases that bypass IT security protocols.
- Reduces IT resources required to support unplanned applications and assets. The IT team can productively focus on their normal tasks.
Eager to see these benefits in your organization? Connect with us!
10 Benefits of Apptio Software for Your Organization
Apptio software offers so much more than IT cost management!
Here are 10 key benefits that Apptio offers to your organization.
Ready to let Apptio go to work for you?
Contact us today!

Expand your Apptio skills at Rego Apptio University – March 10-12, 2025
Join Apptio Community, share best practices, and learn more creative ways that you can take advantage of your investment.

