Strategy Casting – or Casting Strategy Aside?
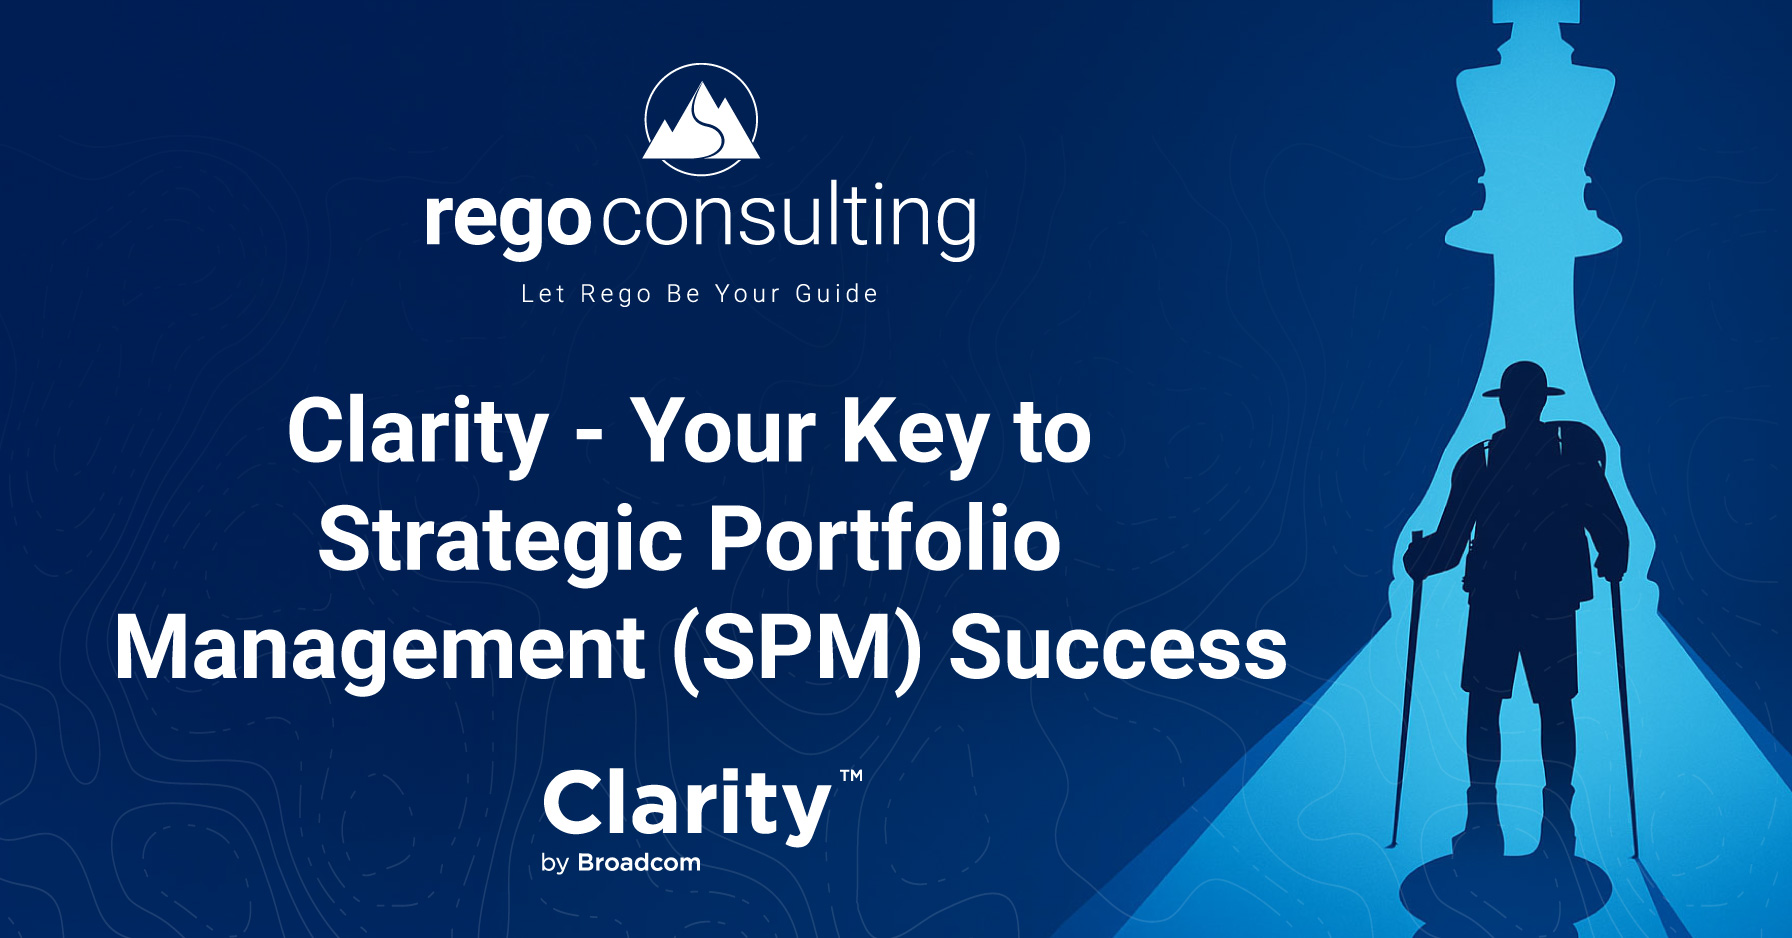
What can chess players and football coaches always agree on?
That strategy is important.
But what would happen if their strategy was not connected to their play-by-play action?
Winning goes out the window.
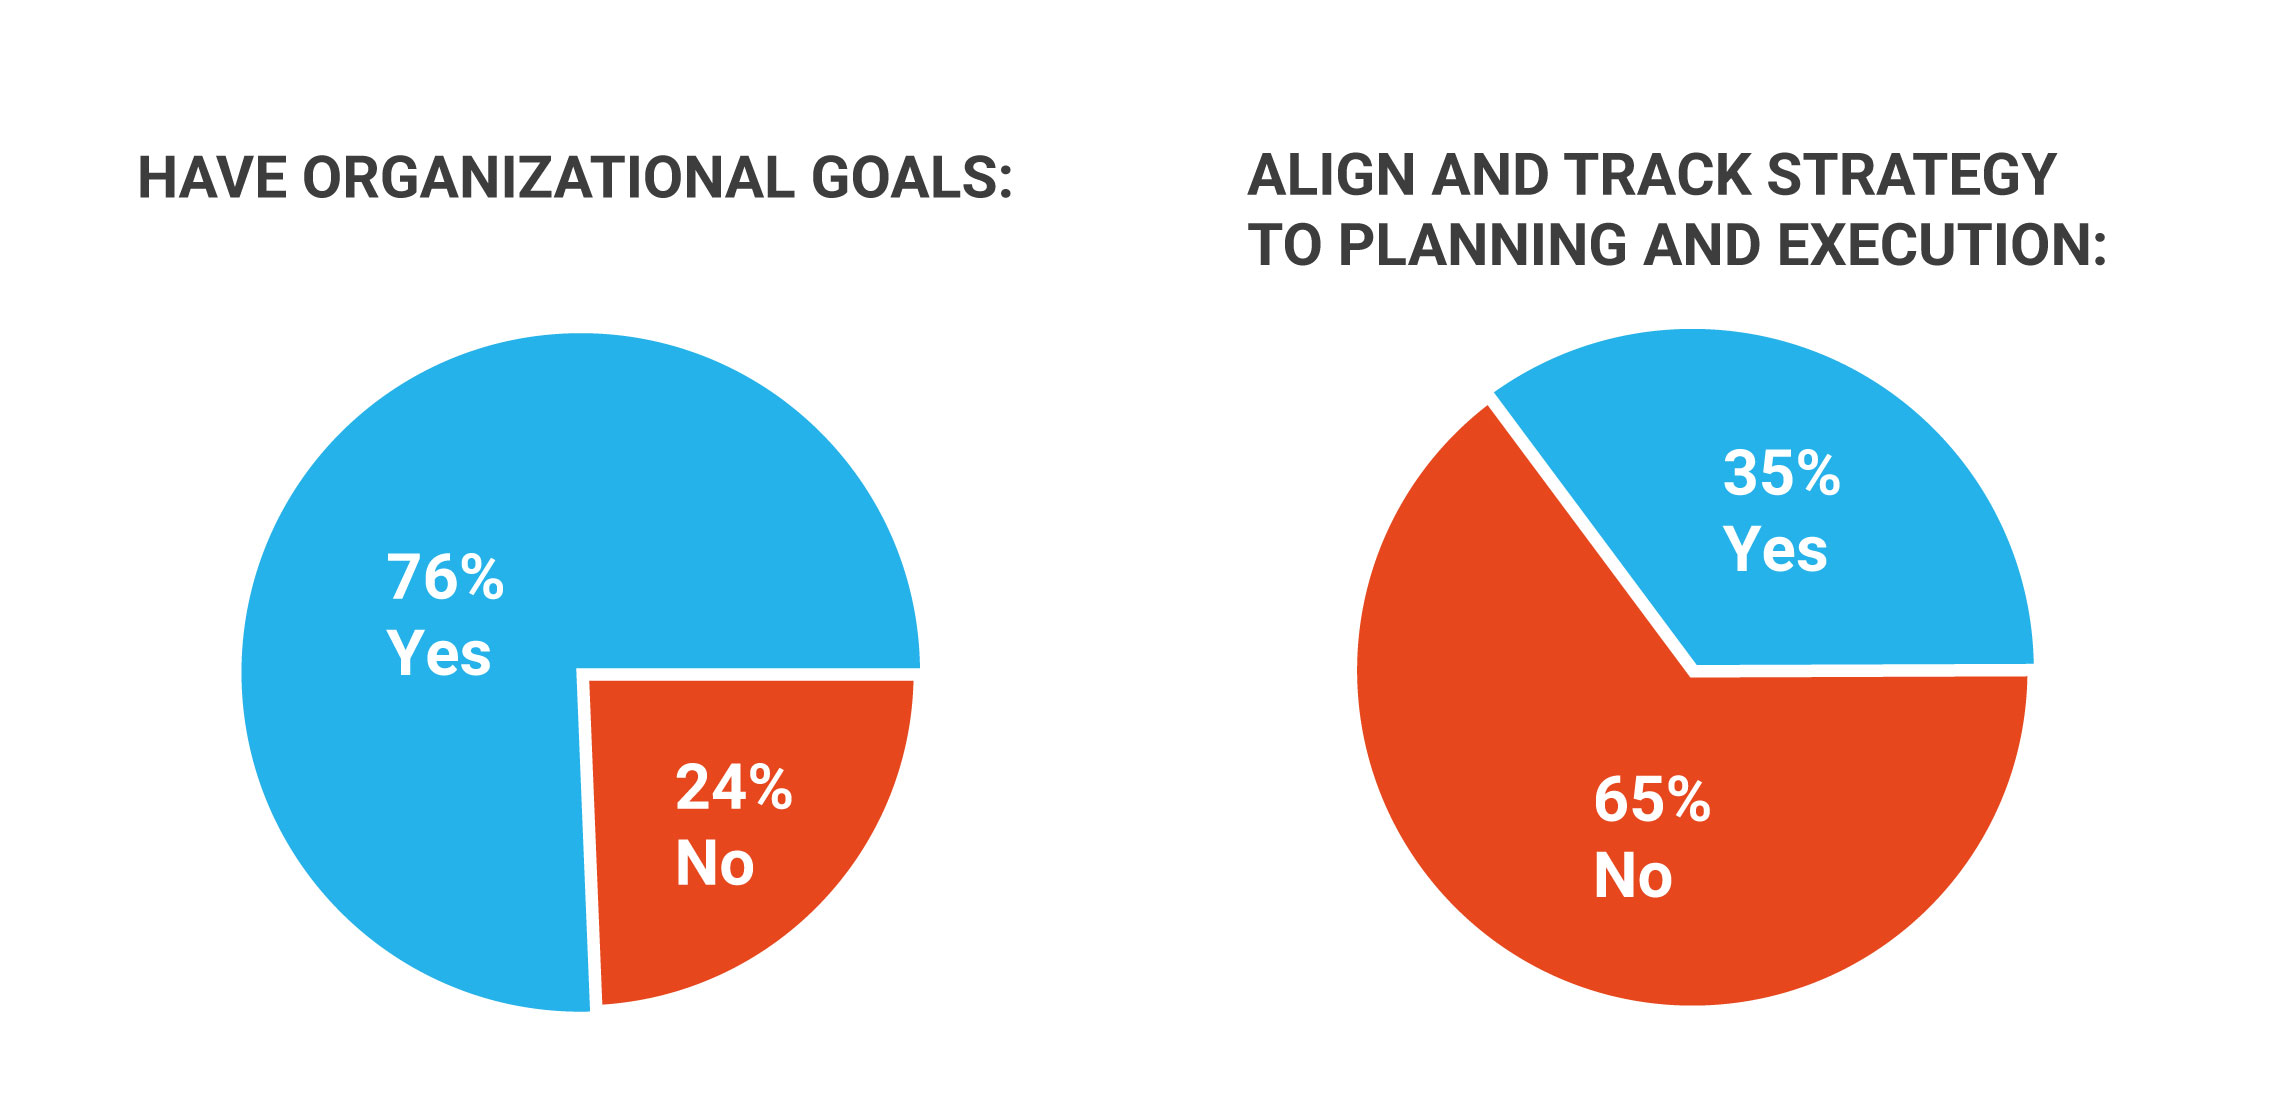
That may seem like a far-fetched scenario, but in a recent poll, Rego Consulting found that:
- While 76% of organizations HAVE established a centralized statement for visions, mission, and values…
- A staggering 65% of organizations are NOT aligning and/or tracking their strategy to planning or execution of work!
Misaligned work can lead to:
With so much at stake, why is work unaligned?
Because it is difficult to link, track, measure, and maintain the connection between strategic objectives and work.

A Quick Refresher: What is Strategic Portfolio Management (SPM)?
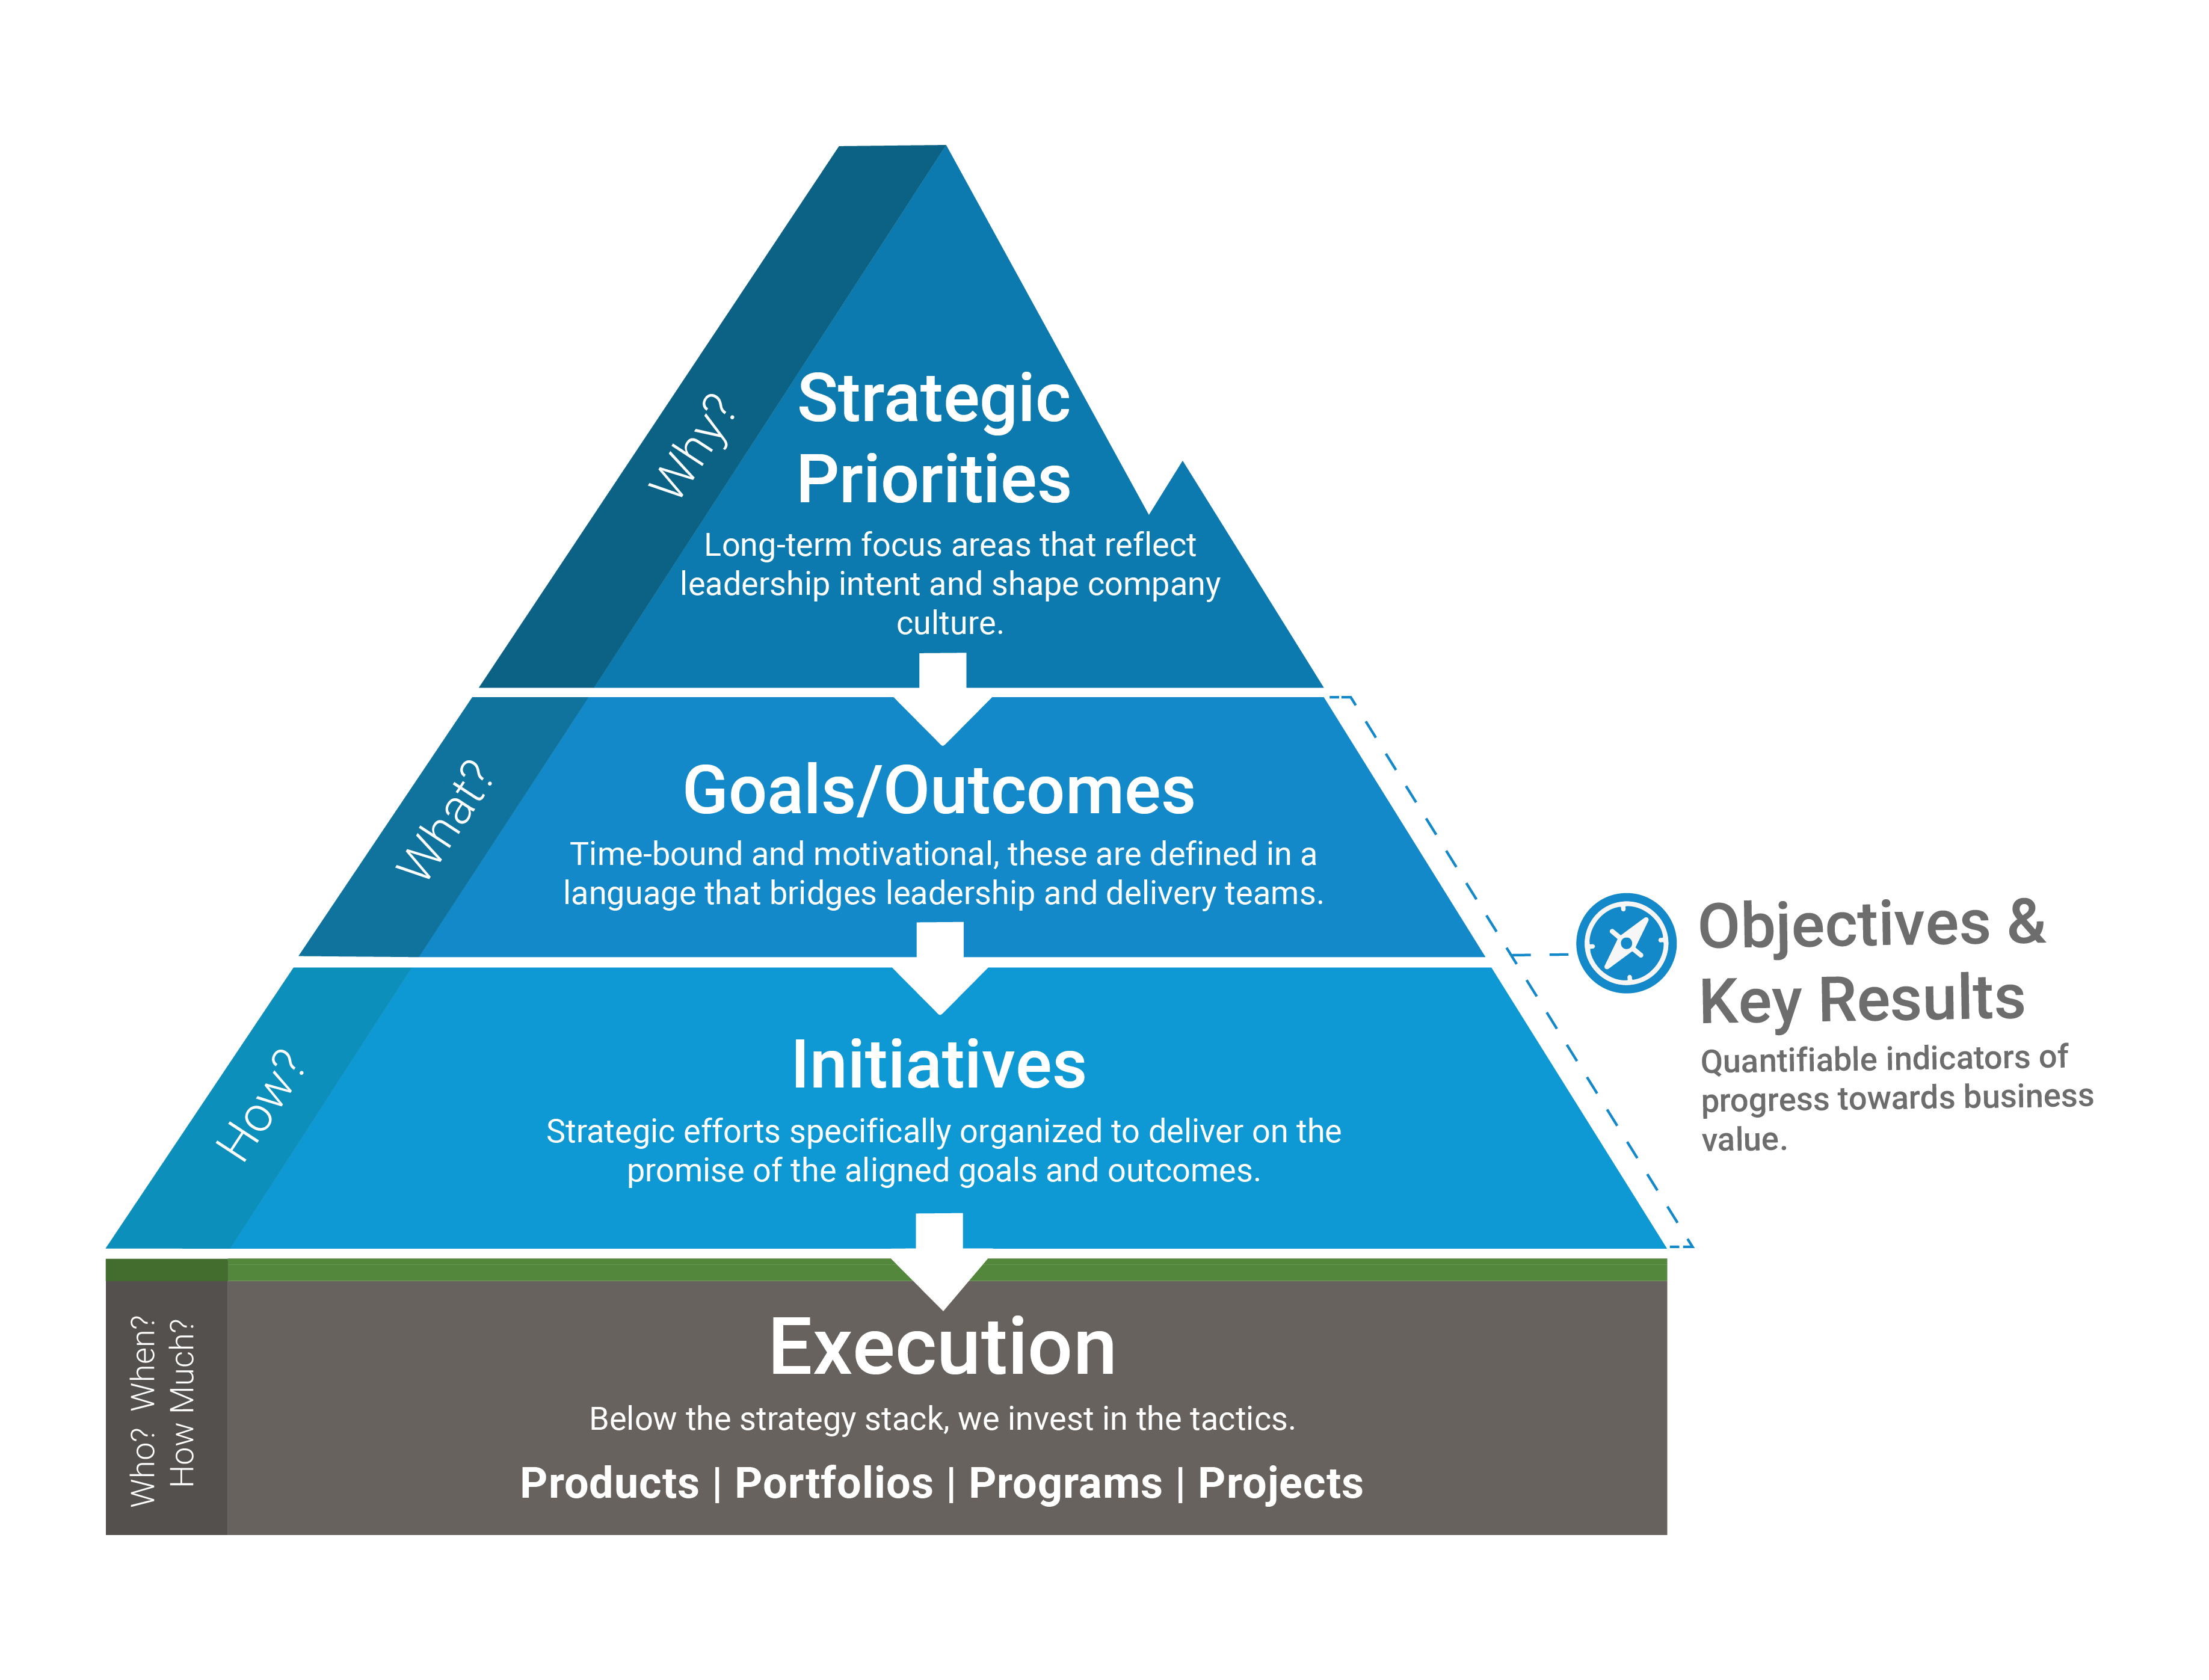
SPM is a framework to achieve business value. It’s a strategy of best practices focused on:
The SPM pyramid displays how organizational strategy cascades down from high-level values into measurable goals, initiatives, and execution.
Want more SPM info? Check out: What is Strategic Portfolio Management (SPM)?
SPM Made Simple: Clarity’s Unique Advantages
Clarity software is ideally designed to support your SPM journey, providing:
- Comprehensive data integration, creating a single source of truth.
- Tools to align and prioritize work with your corporate strategy.
- Flexible configuration of real-time reporting that supports informed decision making.
- Scalable adaptation to fit your evolving business needs.
No matter where you are in the SPM journey, Clarity can help you align organizational strategy with daily work.
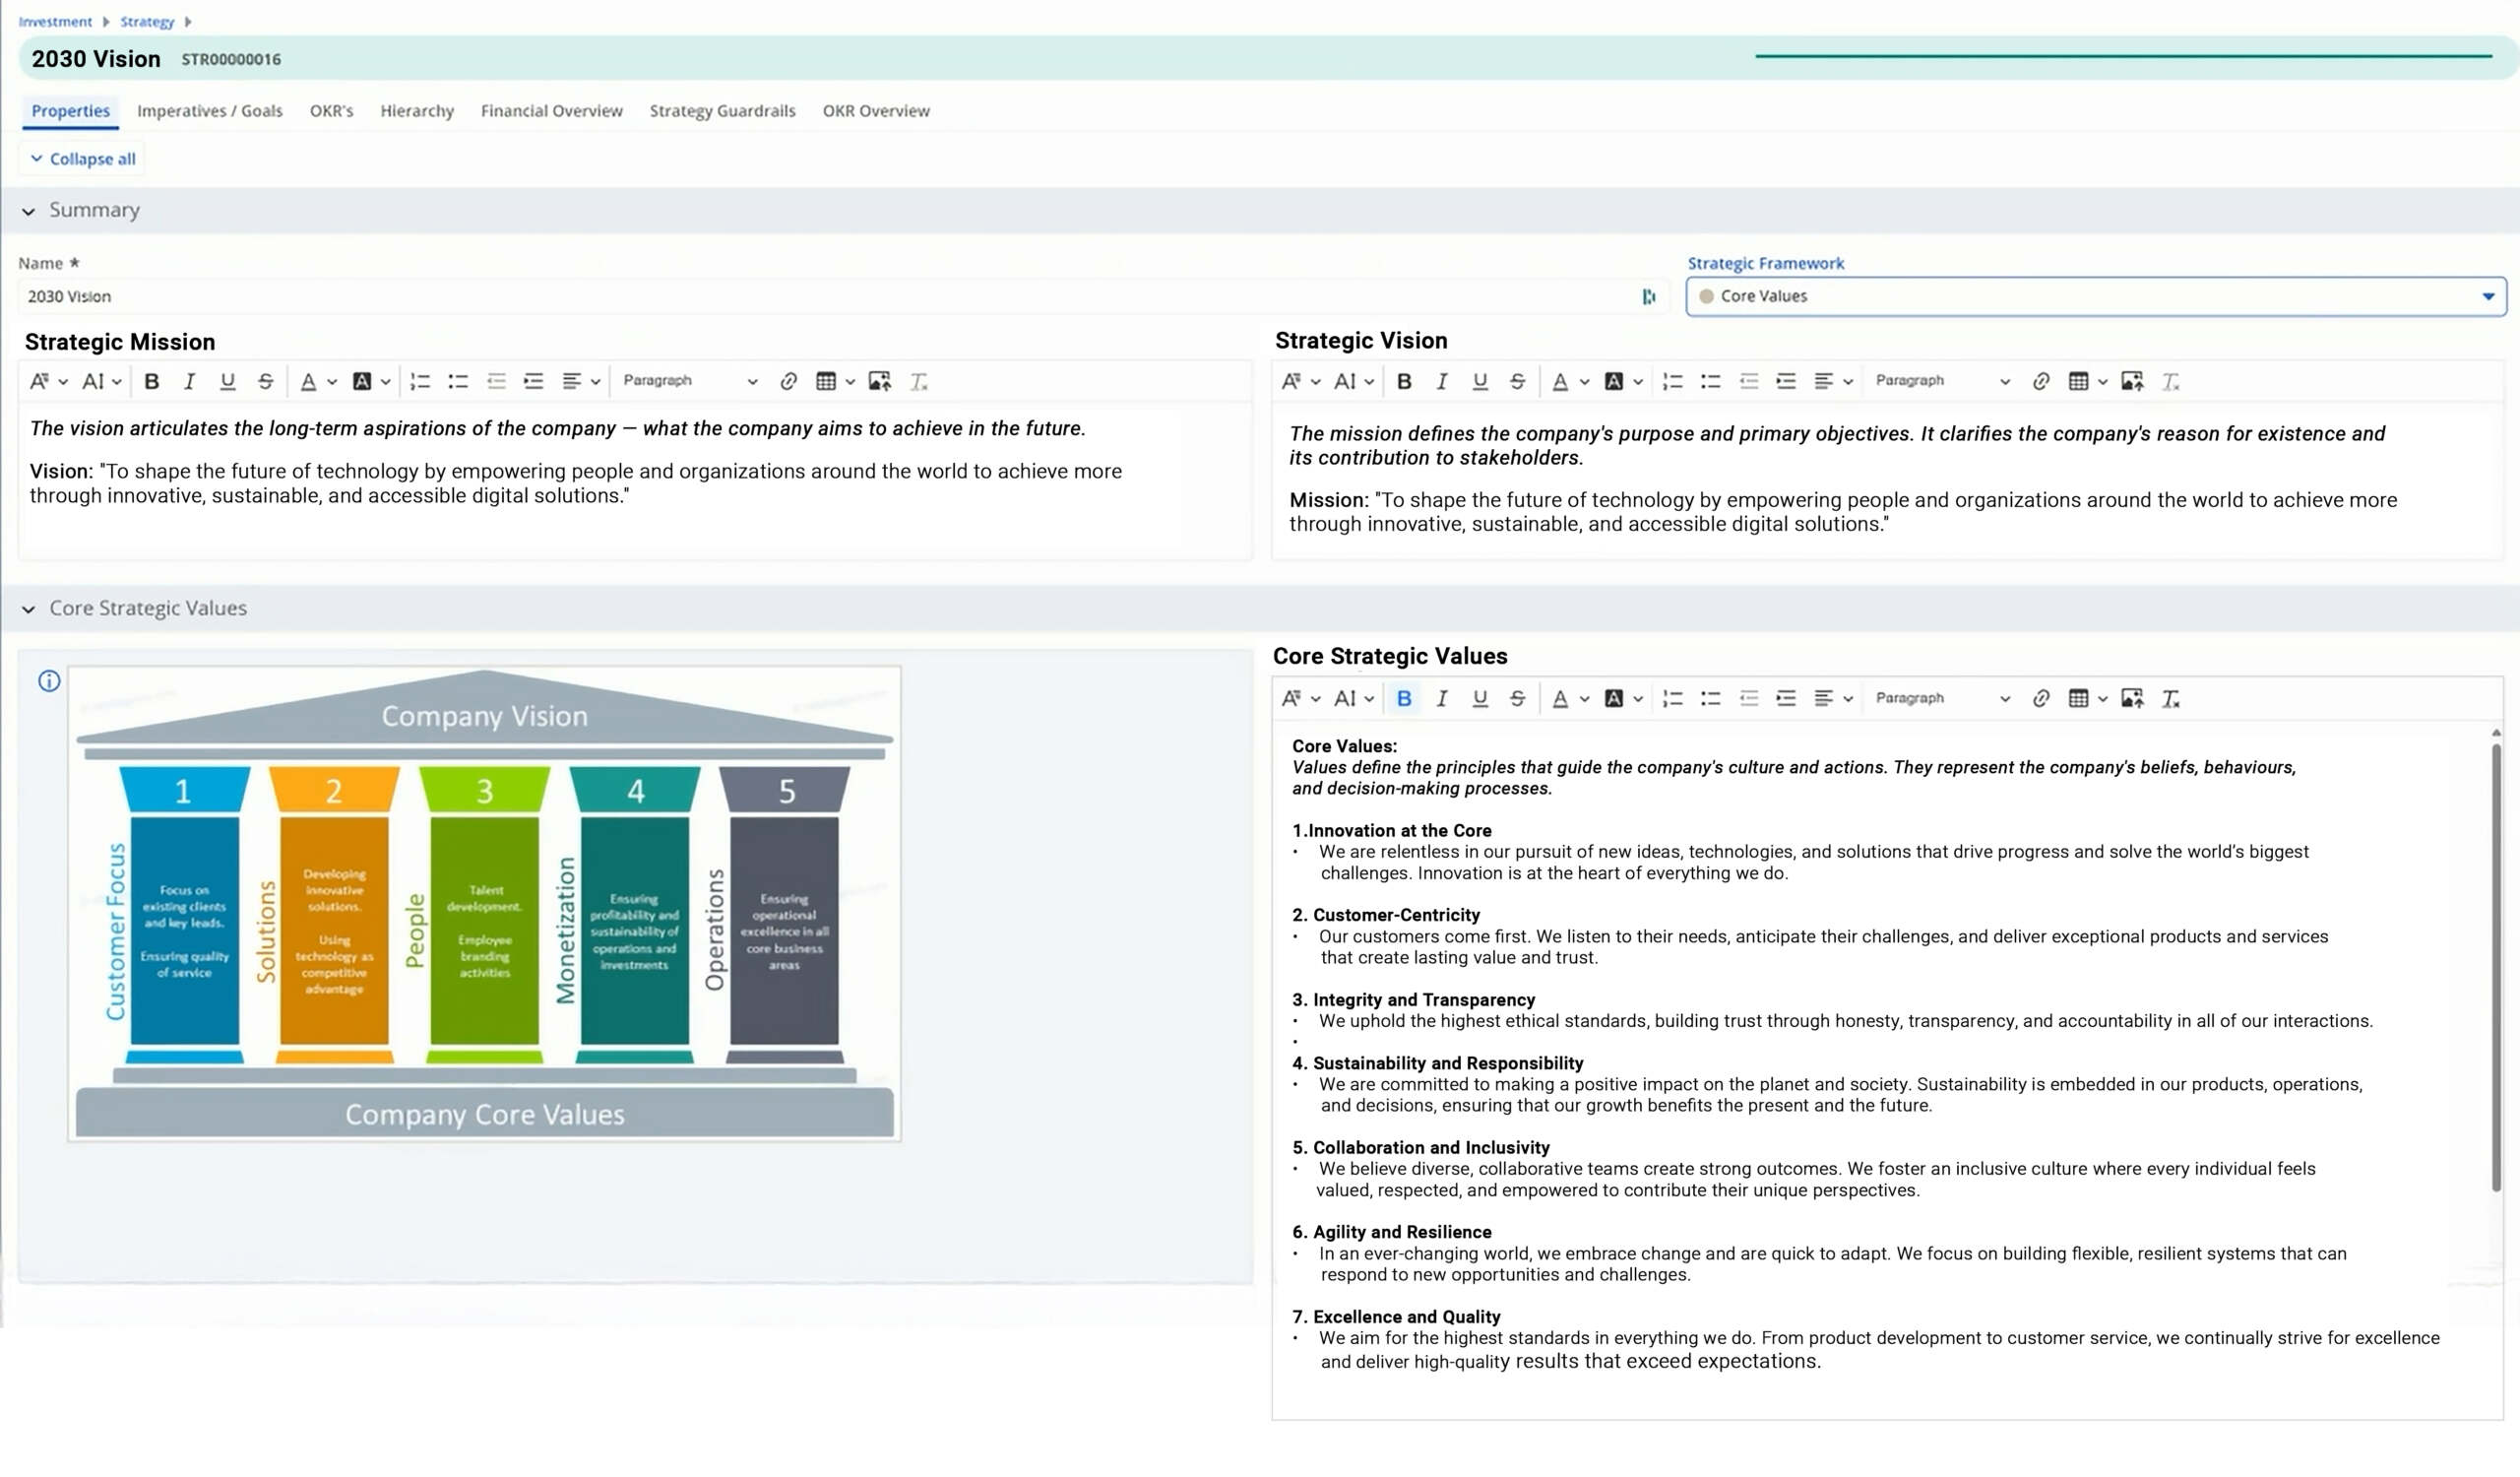
1. Configured Custom Investments Example – Strategy, Mission, and Vision
![]() Video: See how Clarity’s Custom Investments can be configured as the essential starting point of SPM: Strategy, Mission, and Vision, as well a selection of Strategic Frameworks.
Video: See how Clarity’s Custom Investments can be configured as the essential starting point of SPM: Strategy, Mission, and Vision, as well a selection of Strategic Frameworks.
SPM Purpose: Define Values, Mission, and Vision
SPM begins with strategic structuring to establish a clear, top-down framework for business priorities. This structure equips you to align all investments, goals, and execution efforts.
Clarity’s Custom Investments are powerful tools that provide you with control and flexibility to shape your SPM framework, making strategy execution clear, connected, and easier to manage. Custom Investments offer adaptable functionality to bridge the gap between strategy and execution. As priorities shift, you can track value delivery and successfully adapt with data-driven insights.
Key Features of Custom Investments
2. Configured Custom Investment Example – Imperatives and Goals
![]() Video: See how Clarity’s Imperatives and Goals can foster strategic alignment and actionable insights.
Video: See how Clarity’s Imperatives and Goals can foster strategic alignment and actionable insights.
SPM Purpose: Bridge Strategy and Execution with Precision
A key to SPM success is full traceability – connecting strategic goals with execution-level investments (portfolios, projects, products, and financials) – in a structured, measurable way.
Clarity’s Custom Investment Imperatives and Goals serve as the critical “middle layer” of SPM strategy, helping you connect, prioritize, and evaluate the best initiatives to drive strategic direction. With a measurable focus point, you can determine priorities, track progress, and ensure every initiative aligns with strategic intent and produces valuable results. When priorities shift, you are equipped to remain flexible and adapt to changing needs.
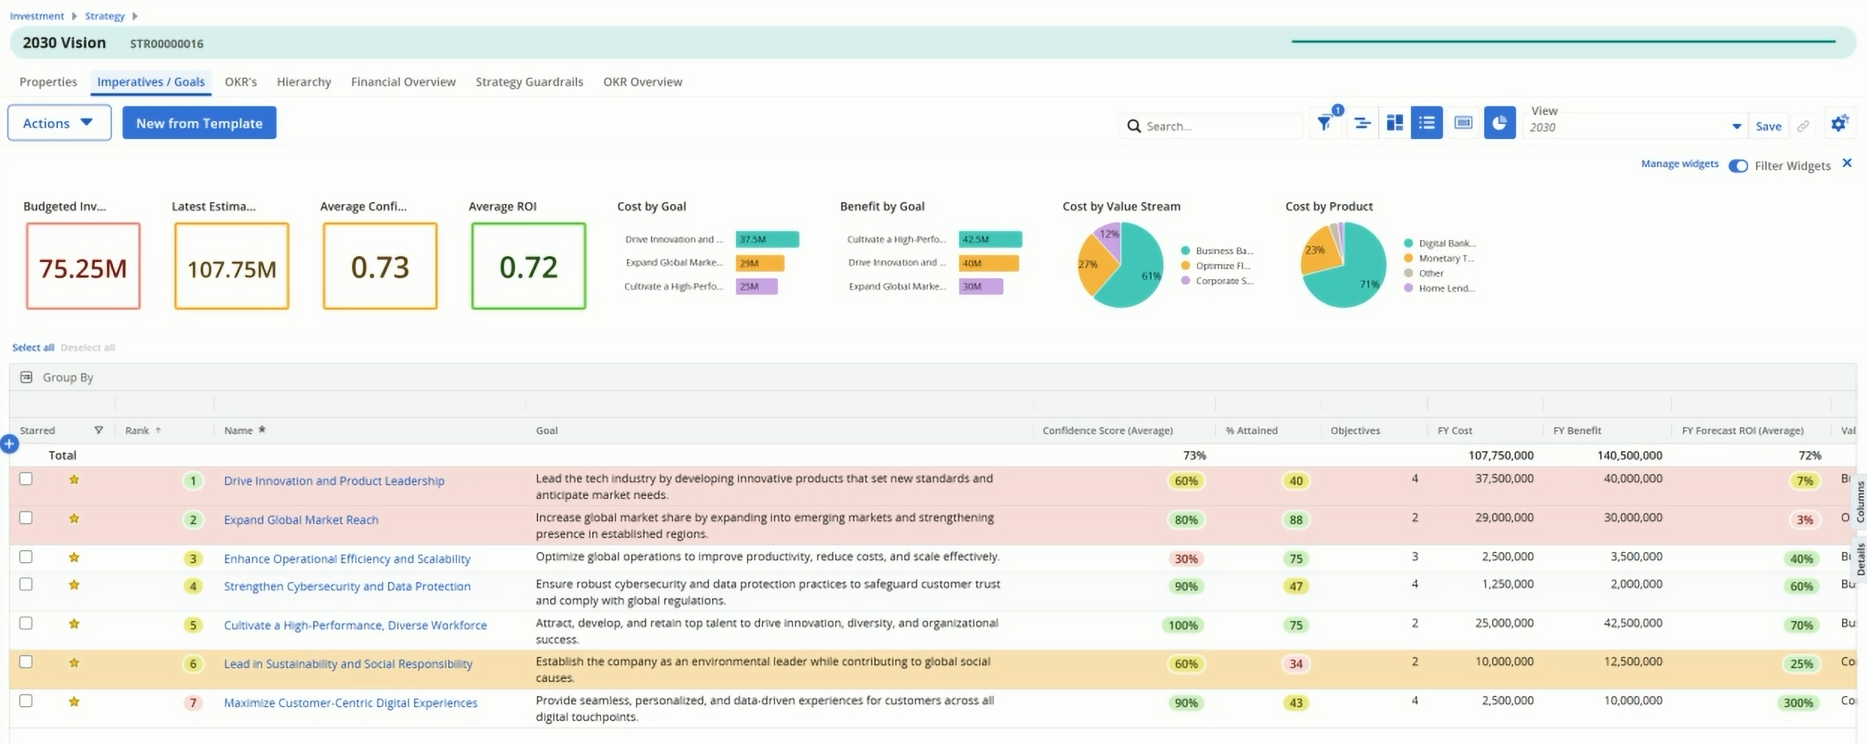
Key Functionality of Imperatives and Goals
3. Configured Custom Investment Example – Objectives and Key Results (OKR)
![]() Video: See Clarity’s versatile OKR functionality, including nested tables for a clear overview of all objectives and goals, OKR board layout, a dive into an under-performing objective, a review of a single key result, OOTB To-Do’s, Target Value, and Actual Value.
Video: See Clarity’s versatile OKR functionality, including nested tables for a clear overview of all objectives and goals, OKR board layout, a dive into an under-performing objective, a review of a single key result, OOTB To-Do’s, Target Value, and Actual Value.
SPM Purpose: Align Goals with Measurable Outcomes
SPM requires organizations to define clear OKRs that align with their long-term goals. OKRs bridge the gap between goals and outcomes. OKRs can be tied to multiple layers of the SPM framework.
Clarity’s Custom Investment OKRs provide a structured yet flexible approach to managing OKRs, giving you the control and flexibility to define strategic priorities, measure progress, and drive execution within a single platform. Unlike rigid OKR tools, Clarity’s Custom Investments enable teams to configure and refine OKRs to fit their unique business needs, ensuring that strategy and execution remain fully aligned.
Additionally, Clarity’s OKR functionality delivers actionable insights – from overall results to detailed objectives. Teams can track OKRs alongside key data points such as lessons learned, action items, and process improvements. This facilitates real-time collaboration and supports a culture of continuous improvement. Ultimately, this results in improved process automation, greater accountability, and enhanced decision-making at every level of the organization.
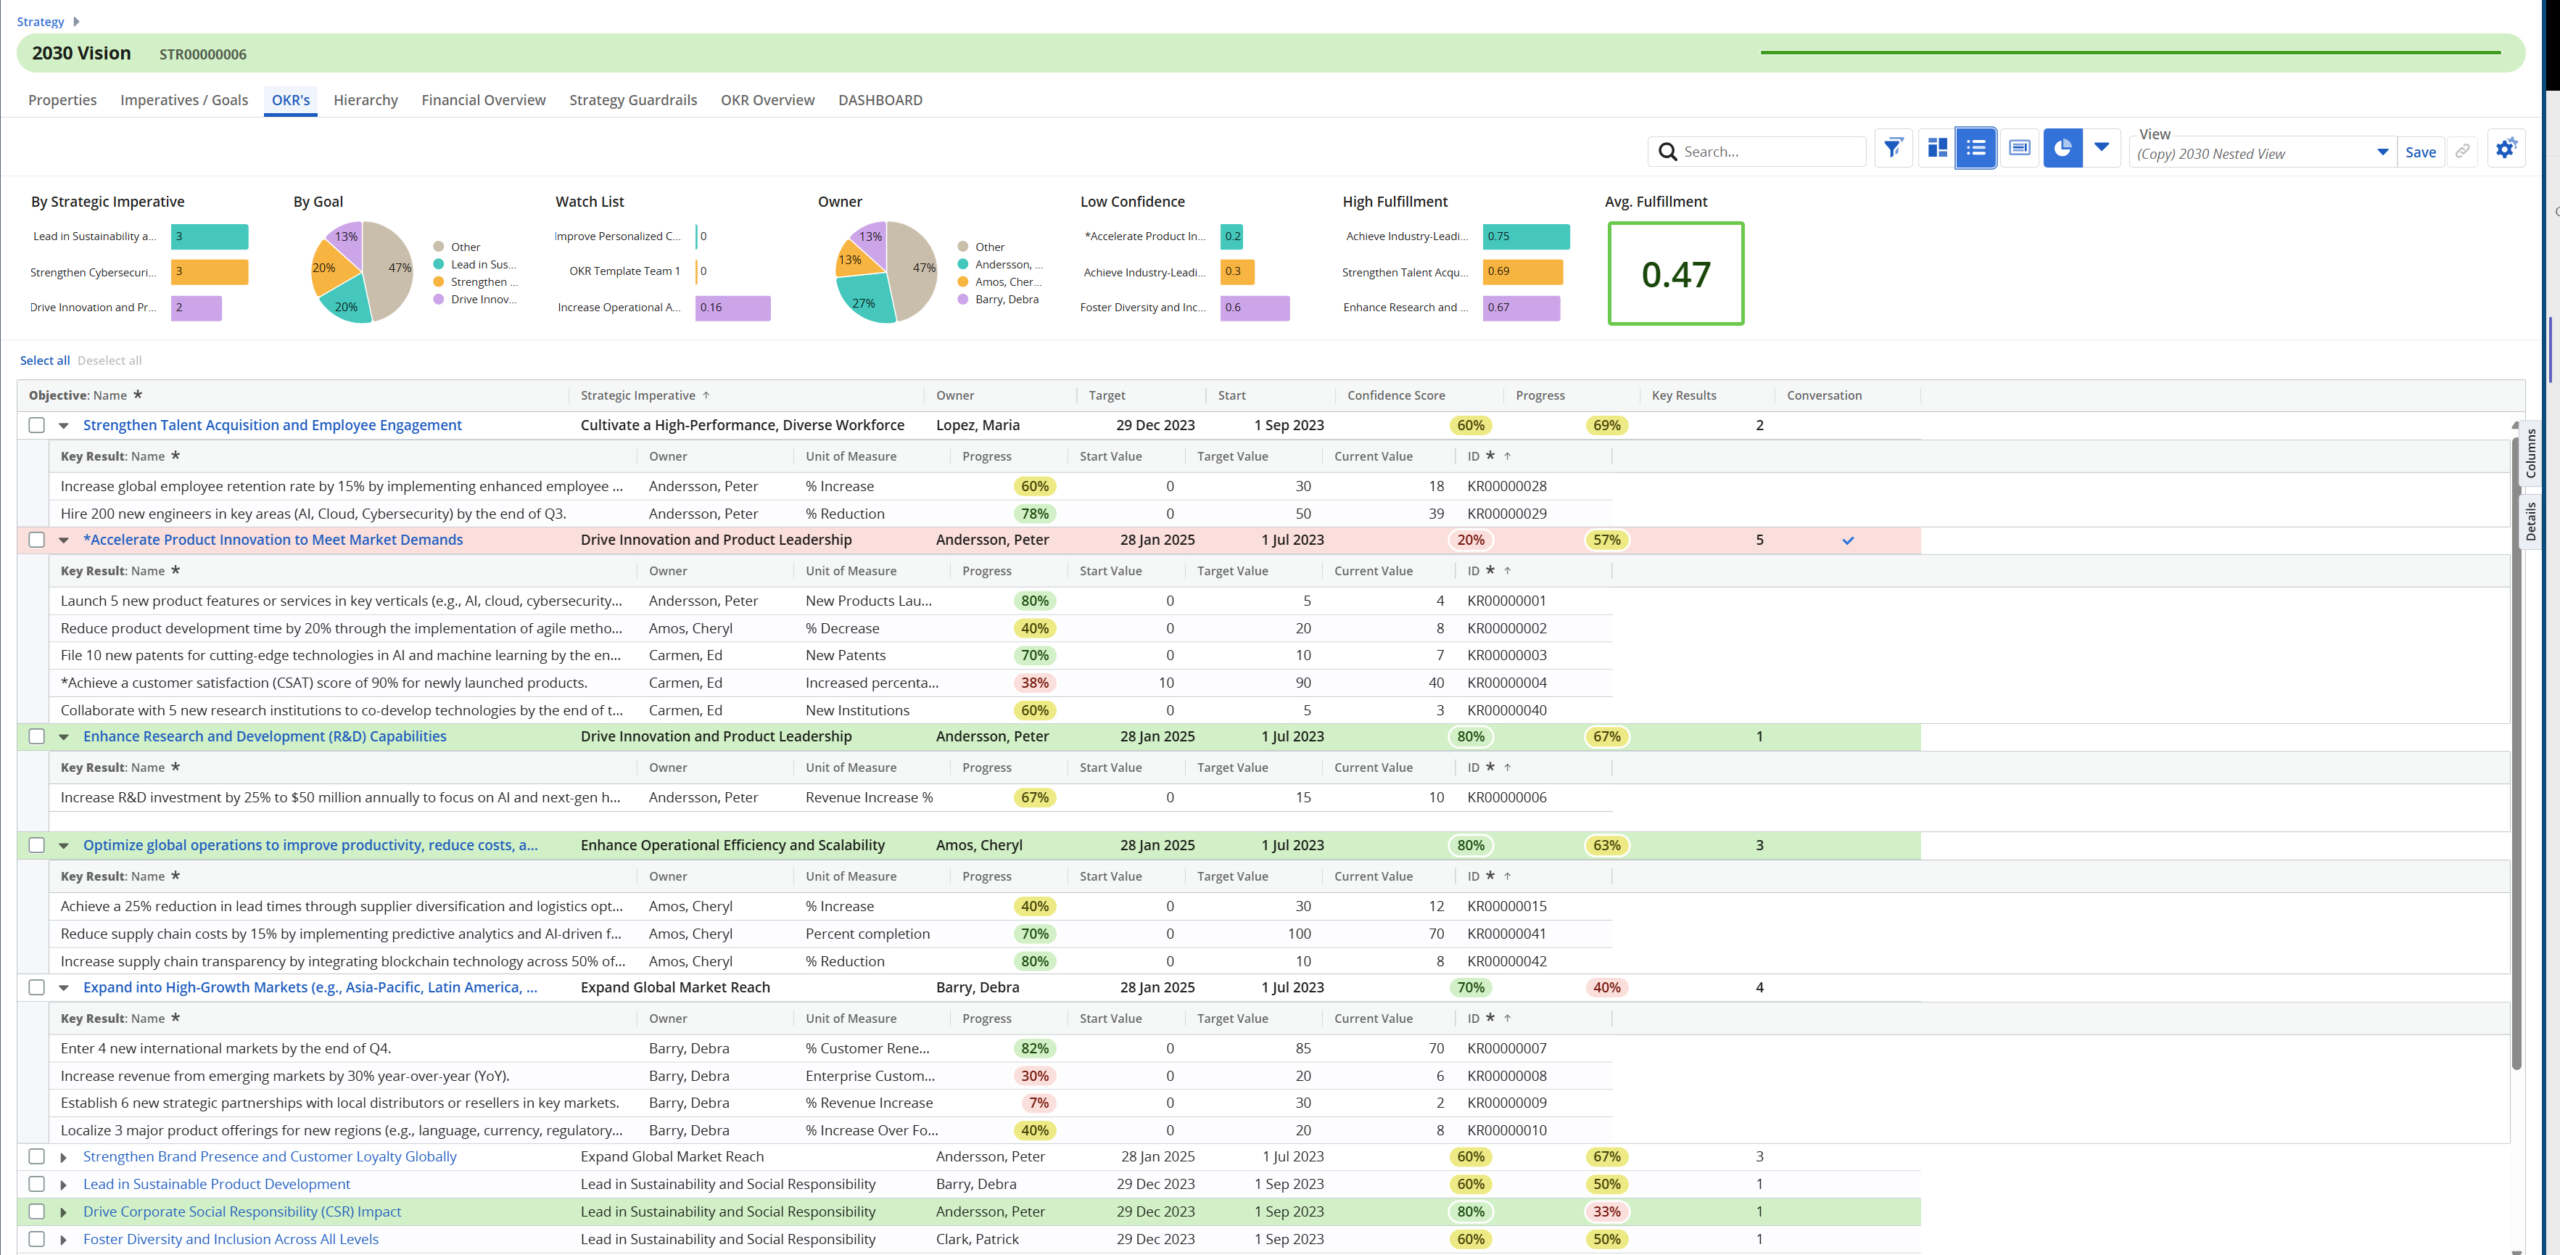
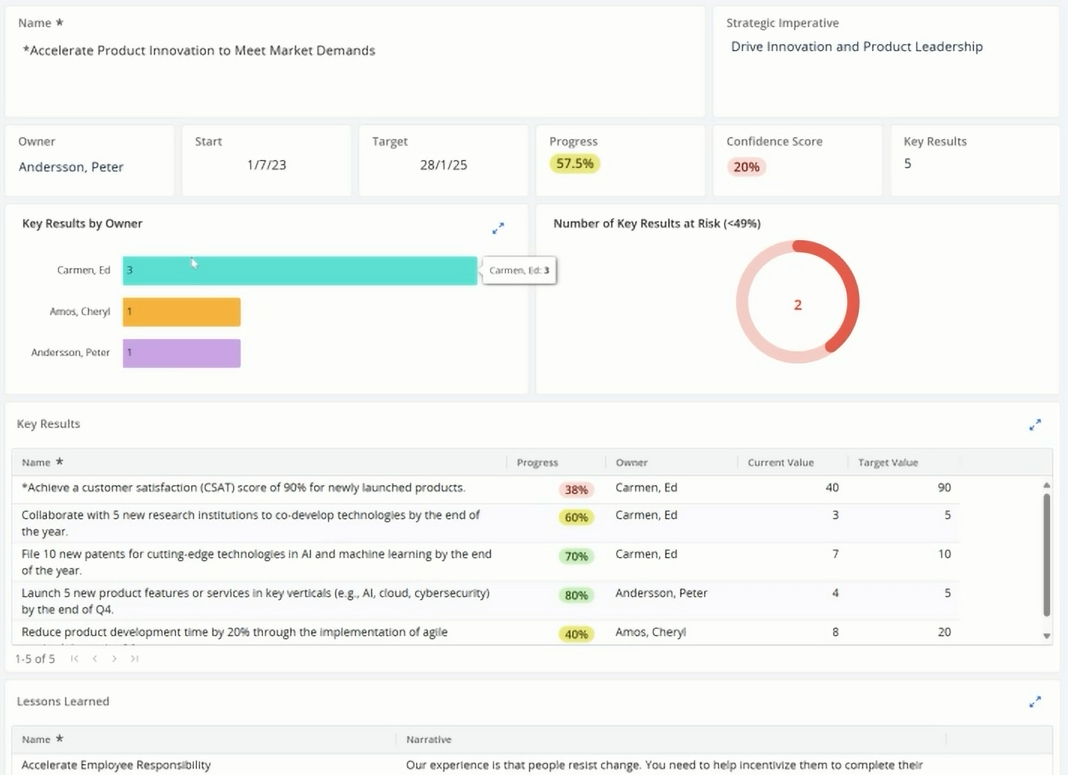
Key Functionality of Objectives and Key Results
4. OOTB Hierarchy Module
![]() Video: Learn about Clarity’s interactive Hierarchy module, including how to create and visualize hierarchical relationships between strategic goals, OKRs, and execution. You’ll see how progress can be tracked with confidence scores and real-time data. Learn how you can navigate dynamically from high-level strategy to individual key results and initiatives.
Video: Learn about Clarity’s interactive Hierarchy module, including how to create and visualize hierarchical relationships between strategic goals, OKRs, and execution. You’ll see how progress can be tracked with confidence scores and real-time data. Learn how you can navigate dynamically from high-level strategy to individual key results and initiatives.
SPM Purpose: Visualize and Trace Strategic Alignment
Effective SPM relies on a clear, structured view of how strategic objectives translate into actionable initiatives.
Clarity’s OOTB Hierarchy module provides a dynamic, interactive framework that links all levels of SPM. It offers traceability from top-level strategy to execution, empowers alignment, transparency, and data-driven decision-making.
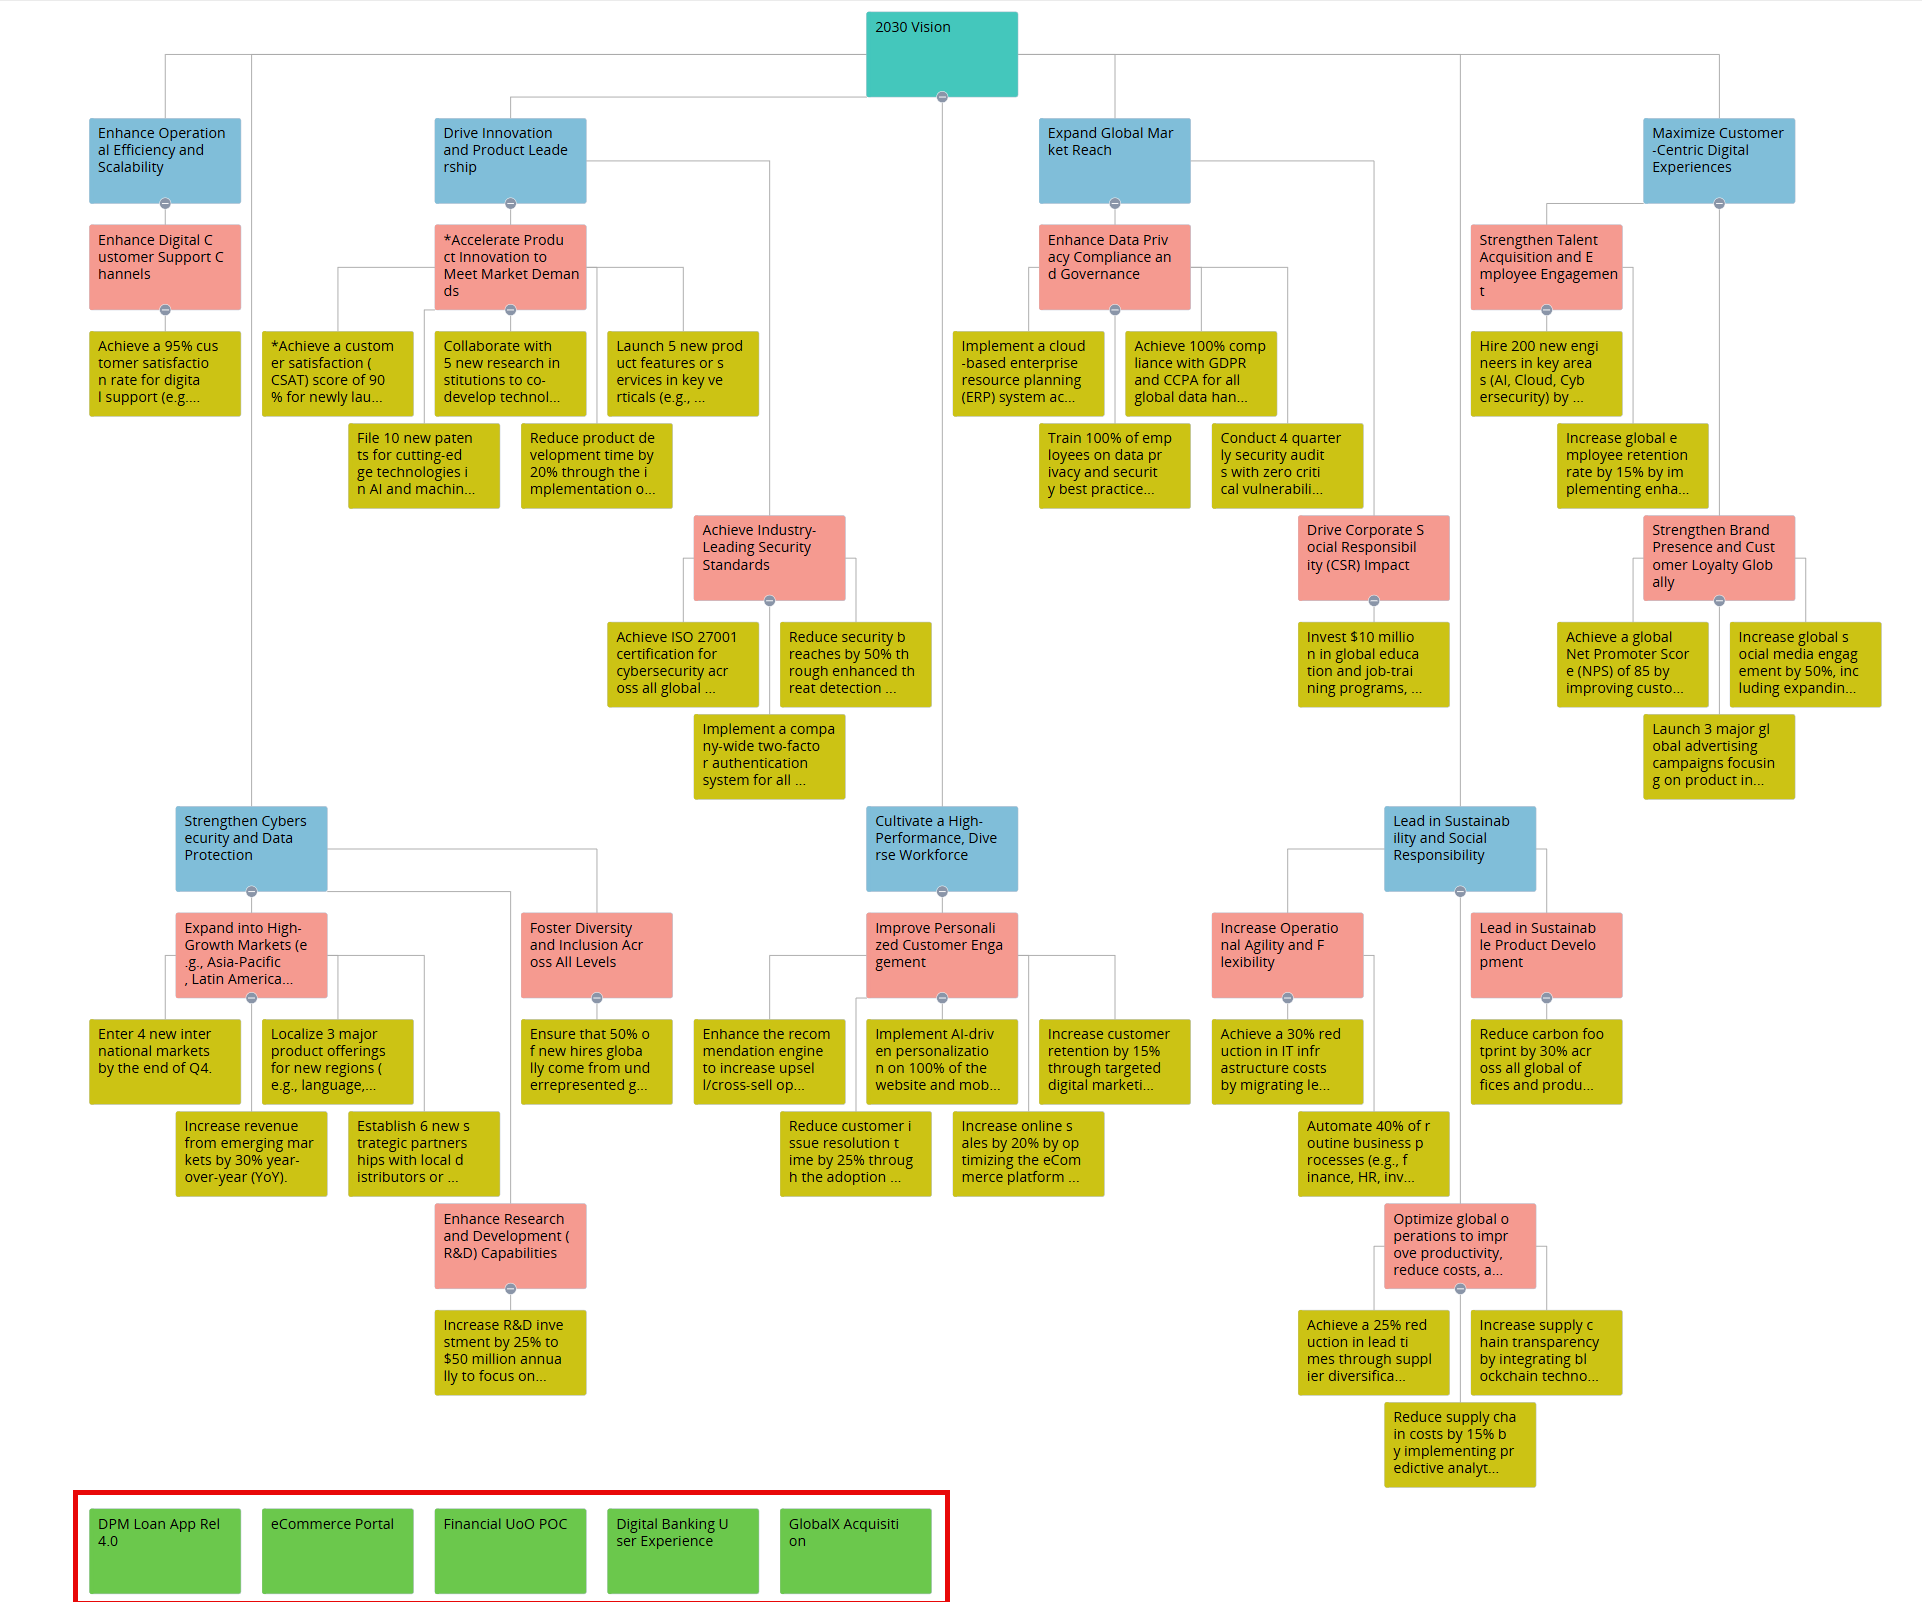
Key Functionalities of the Hierarchy Module
5. Configured Power BI Example: Financial Overview Report
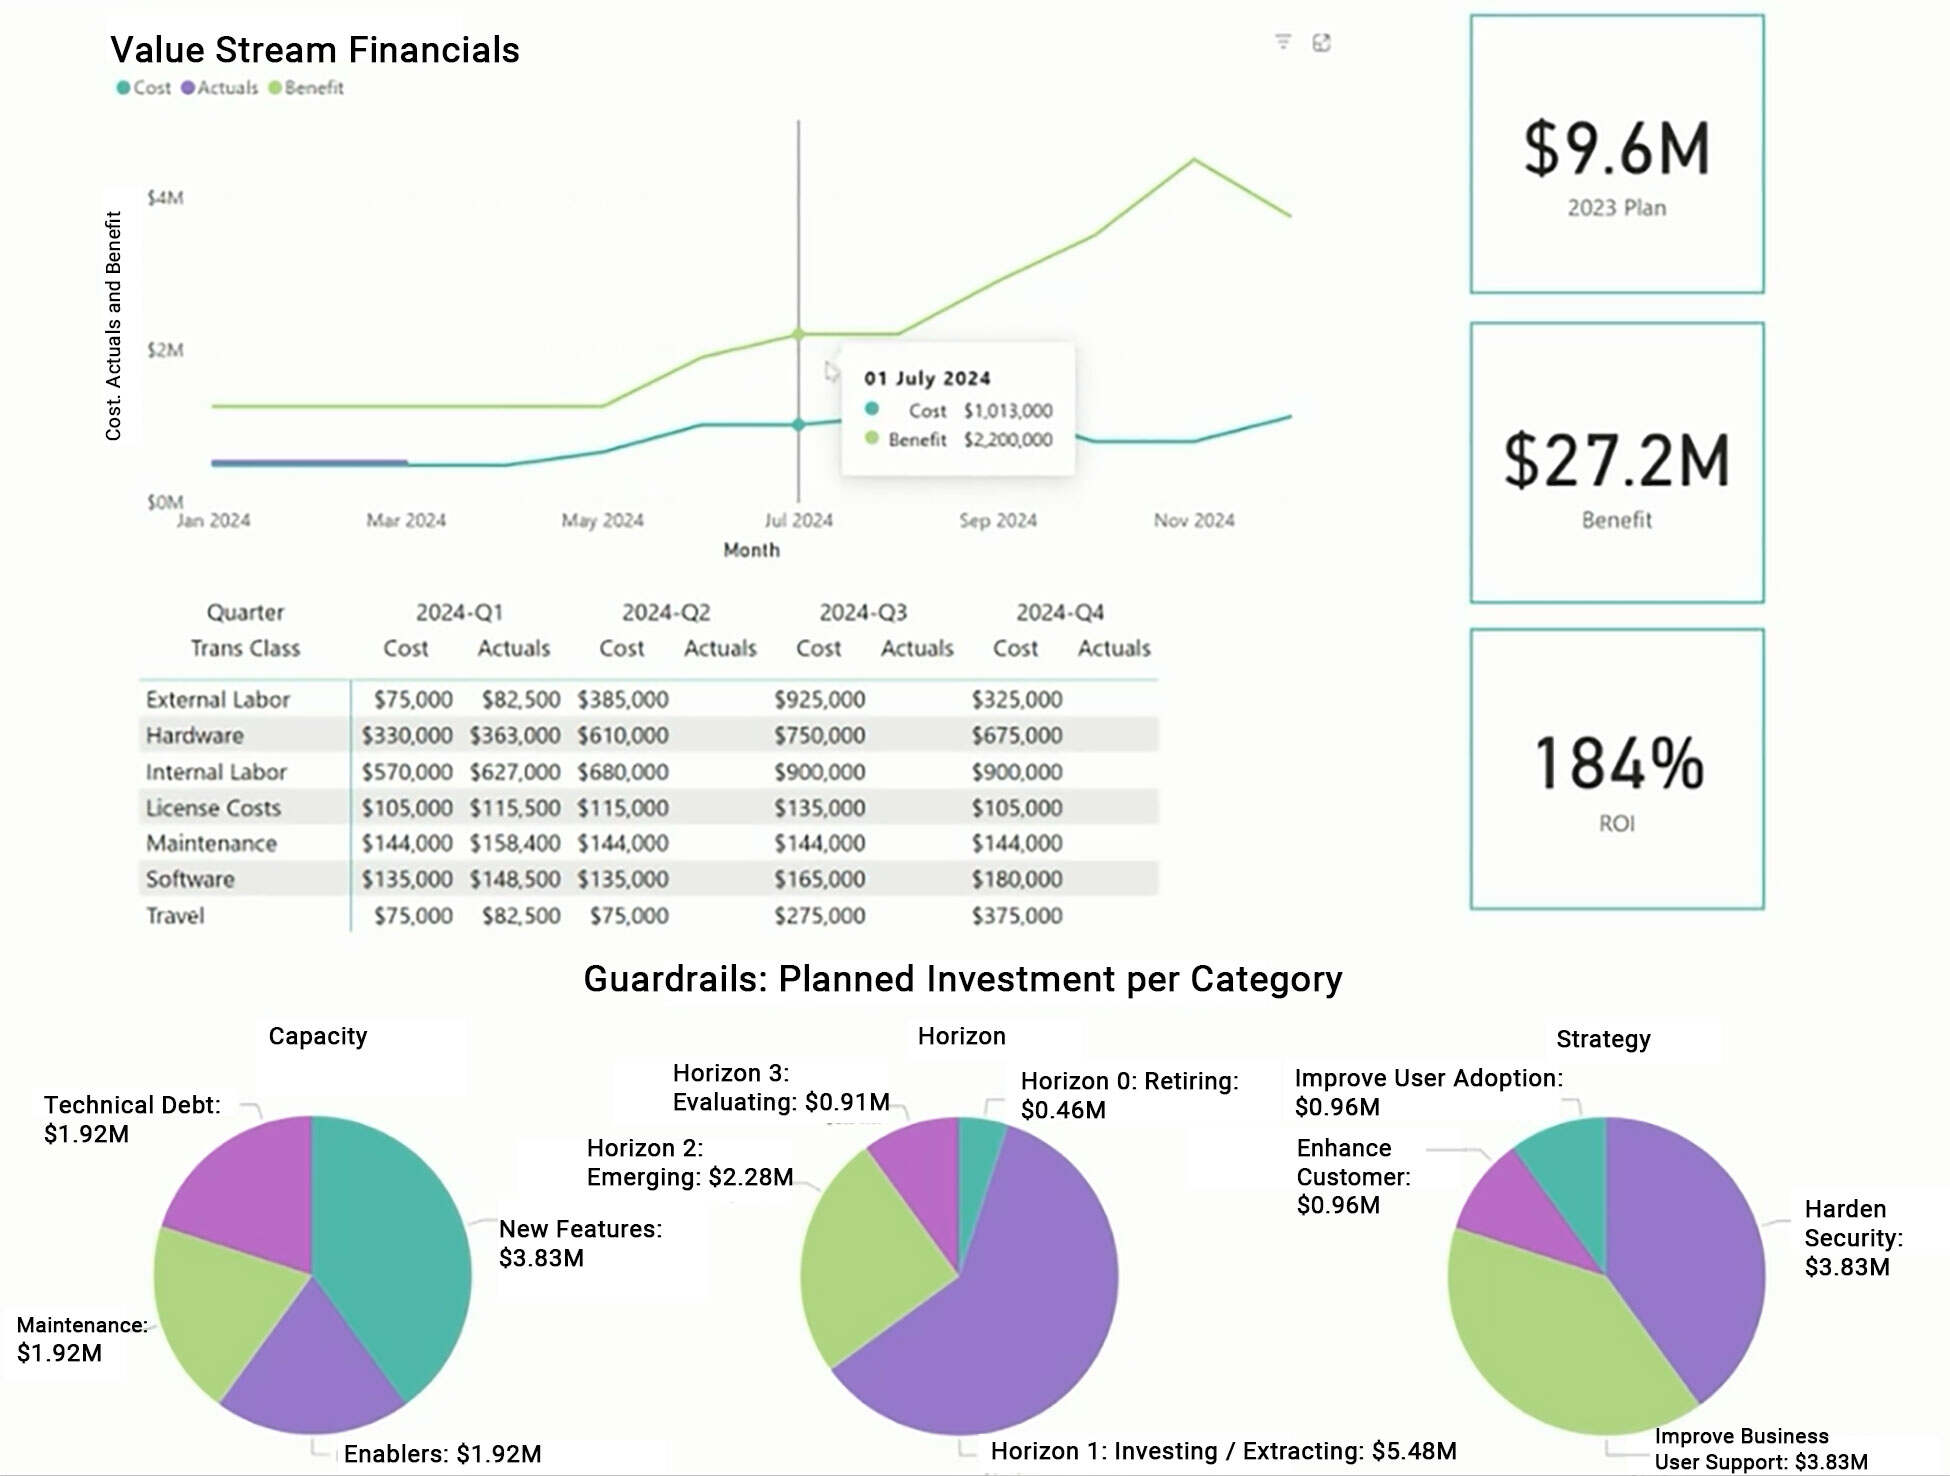
SPM Purpose: Optimize Investment Portfolios
For maximum success, SPM requires real-time visibility into financial performance, ensuring that investments align with business objectives and expected returns.
Clarity’s Custom Investment Financial Overview Report (a Power BI tie-in) provides the financial transparency needed to maximize investment value and drive strategic success with a comprehensive view of financial performance across portfolios, projects, and strategic initiatives. It tracks budgets, costs, benefits, and ROI across initiatives. Additionally, you can compare planned vs. actual spending, analyze trends, and maximize investment strategies. With these actionable insights, you can optimize your portfolios and ensure every investment aligns with strategic, data-driven decisions.
⚠️ Remember: Accurate data leads to accurate decisions!
6. Configured Power BI Example: Strategy Guardrails Report
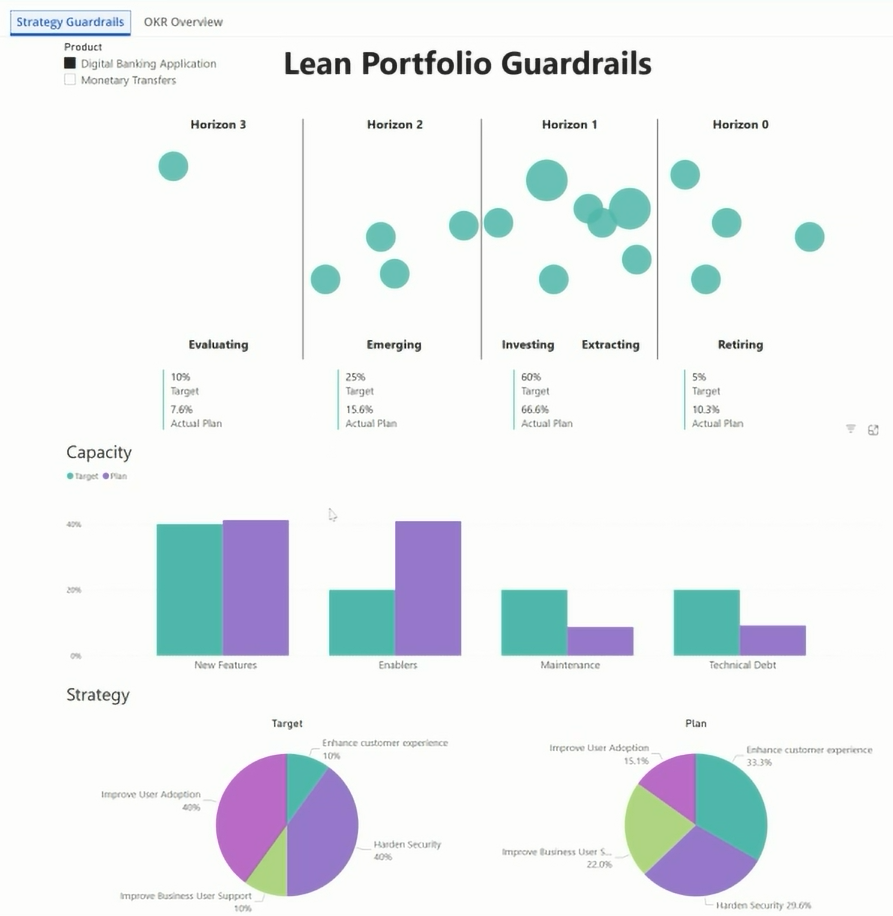
SPM Purpose: Ensure Strategic Balance and Accountability
A key factor in SPM success is controlling investment allocation to maintain a balance between innovation, growth, and operational stability.
Clarity’s Custom Investment Guardrails Report (a Power BI tie-in) provides real-time insights into how finances and resources are performing within your guardrails, ensuring that investments drive the right balance of growth, innovation, and sustainability. You can visualize how investments align with strategic guardrails, such as planned spend profiles, priorities, and risk boundaries. By surfacing trends, exceptions, and areas of misalignment, this report fosters a deeper understanding of strategic execution and drives informed decision-making. Additionally, you can see how resources are distributed and ensure that strategic investments align with business priorities and financial constraints.
This report helps you learn from less-than-perfect previous outcomes, equipping you to evaluate planned vs. actual investments. For future projects, you can allocate funding appropriately across emerging initiatives, critical operations, and long-term strategic goals.
Key Functionalities of the Strategy Guardrails Report
7. Configured Power BI Example: Strategic Themes Dashboard
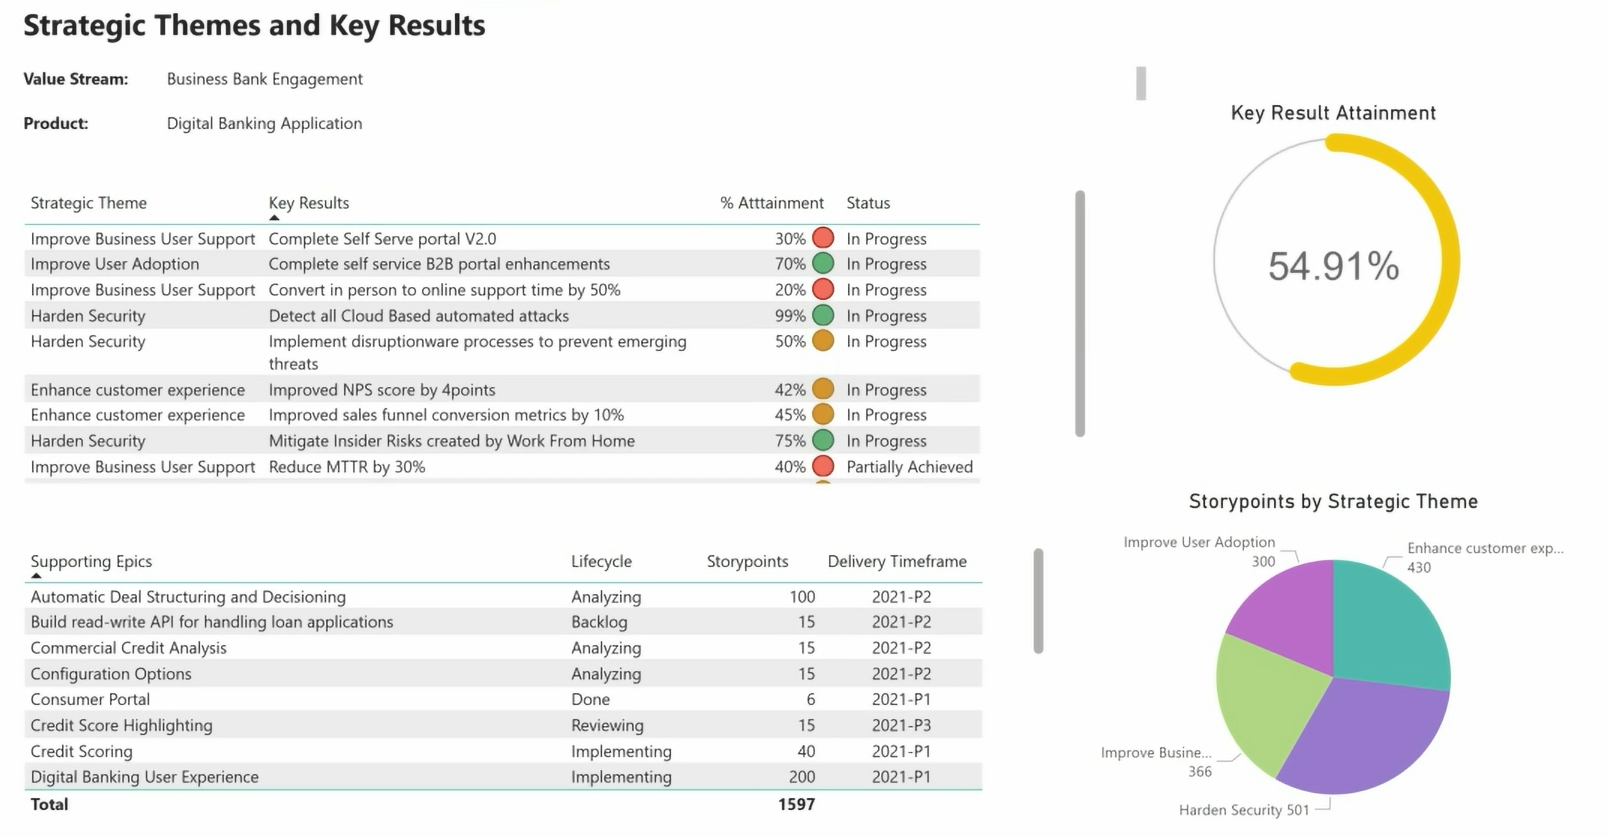
SPM Purpose: Focus on High-Impact Priorities
SPM helps organizations prioritize investments that align with key business themes, aligning funding and execution with corporate strategy.
Clarity’s Custom Investment Strategic Themes Dashboard (a Power BI tie-in) transforms high-level strategy into actionable insights, ensuring that business priorities drive investment, execution, and measurable success. This high-level, visually rich view consolidates data across portfolios, programs, and projects to show you how investments are aligned with strategic priorities. You can track performance of key results, identify gaps, and integrate strategy with Agile execution. This dashboard empowers you to make data-driven decisions and optimize measurable outcomes.
Key Functionalities of the Strategic Themes Dashboard
Get Started with SPM in Clarity
![]() Video: See how Clarity’s flexible configuration options can support SPM, whether you need a simple setup or a fully detailed architecture.
Video: See how Clarity’s flexible configuration options can support SPM, whether you need a simple setup or a fully detailed architecture.
Utilize these practical steps to begin your SPM journey with Clarity.
- Define clear top-level strategy and value to ensure alignment across your organization.
- Engage stakeholders in change management to drive adoption and collaboration.
- Start small to achieve quick wins early and build a scalable, sustainable framework.
- Begin with foundational elements and expand as maturity increases.
- You don’t have to have all the information, and it doesn’t have to be perfect. Clarity will help you refine your data as you go.
- Remember: Any insight is a helpful insight!
- Break down strategy into actionable goals using Clarity’s features to efficiently drive execution.
- Periodically review and adjust your SPM framework to ensure alignment with business needs to maintain agility in dynamic environments.
Summary
Strategic Portfolio Management (SPM) is a framework of best practices that connects business strategy to work, ensuring every initiative aligns with organizational goals and delivers value.
Clarity empowers organizations to embrace a thriving SPM practice. With tools that consolidate data from multiple sources into goal alignment and real-time reporting, Clarity simplifies complexity. Teams gain data-based insights to make informed decisions, streamline processes, optimize resources, and track measurable outcomes.
Clarity’s flexible, low-code/no-code platform grows with your organization. So, whether you’re just starting your SPM journey or refining your approach, Clarity adapts to your unique organization and equips you for success.
Learn More
Enrich your SPM journey with Rego’s resources and expertise.
🚩Stay tuned! The next Rego webinar in the SPM series will be announced soon!
 Get Help with Your SPM Journey
As expert SPM and Clarity guides, Rego Consulting can partner with your organization. They help large enterprises adopt best practices for strategic alignment, effective planning, monitoring, and evaluation. Rego offers a range of services including digital ecosystem assessments, coaching to define OKRs, revitalizing implementations, and managed support.
Check out the service offerings available to you!
Rego’s SPM Consulting Services
- Project Planning and Strategy
- Scope Management and Change Control
- Resource Allocation and Management
- Risk Identification and Mitigation
- Stakeholder Communication and Reporting
- And more!

- Strategy Casting – or Casting Strategy Aside?
- A Quick Refresher: What is Strategic Portfolio Management (SPM)?
- SPM Made Simple: Clarity’s Unique Advantages
- Video Demonstration: Key Clarity Features that Support SPM
- 1. Configured Custom Investments Example – Strategy, Mission, and Vision
- 2. Configured Custom Investment Example – Imperatives and Goals
- 3. Configured Custom Investment Example – Objectives and Key Results (OKR)
- 4. OOTB Hierarchy Module
- 5. Configured Power BI Example: Financial Overview Report
- 6. Configured Power BI Example: Strategy Guardrails Report
- 7. Configured Power BI Example: Strategic Themes Dashboard
- Get Started with SPM in Clarity
- Summary
- Learn More
- Get Help with Your SPM Journey
- About the Author: Rego Consulting
