
Clarity version 16.1.3 has introduced some fantastic updates to its resource management capabilities.
New features will allow you to further streamline your search results when reviewing resource allocations, and for the first time ever, you will now be able to view resource assignments across multiple projects and all resources. This is incredibly helpful for organizations that focus heavily on ETC (estimate to complete) as part of resource planning activities.
In this article, we’ll take you through some changes to your system settings, as well as the Staffing module.
Per-Period Metrics
The way that you add Per-Period Metrics to your views has been updated. This is a change that improves many areas of the system, including the Project and Idea list views, but in this case, we will show you how it changes Staffing.
From the (newly named) Staff tab on the Staffing page, you will see the Per-Period Metric fields are now accessible from the Columns panel. They are no longer part of the View Options page.

You will still go into View Options to select the period type (e.g., Months, Weeks, etc.) and also the start and finish dates for your metrics. However, there are now great new features available to help you streamline your Staffing views.
Type
You now have the ability to choose between Periods or Duration. Periods are consistent with previous Clarity versions and will allow you to specify the start and end periods for your view.

Duration
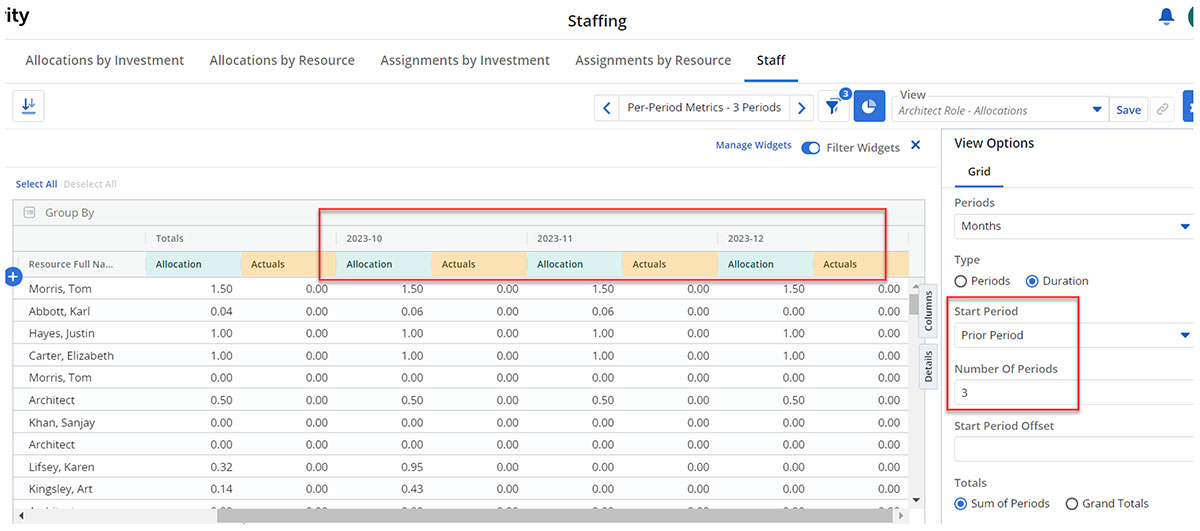
Durations are new and provide a fantastic mechanism to give you greater control and flexibility in how you create and maintain your views. You can now create a rolling view, which means you can always view data in relation to your current date.
In the example below, we have specified that we always wish to view data from the prior period, and we would like to view data for 3 months.
The beauty of this feature is that you can save this view, and every time you go back to it, you will always see your data based on the current date. There is no need to go back and alter your views as time goes on.
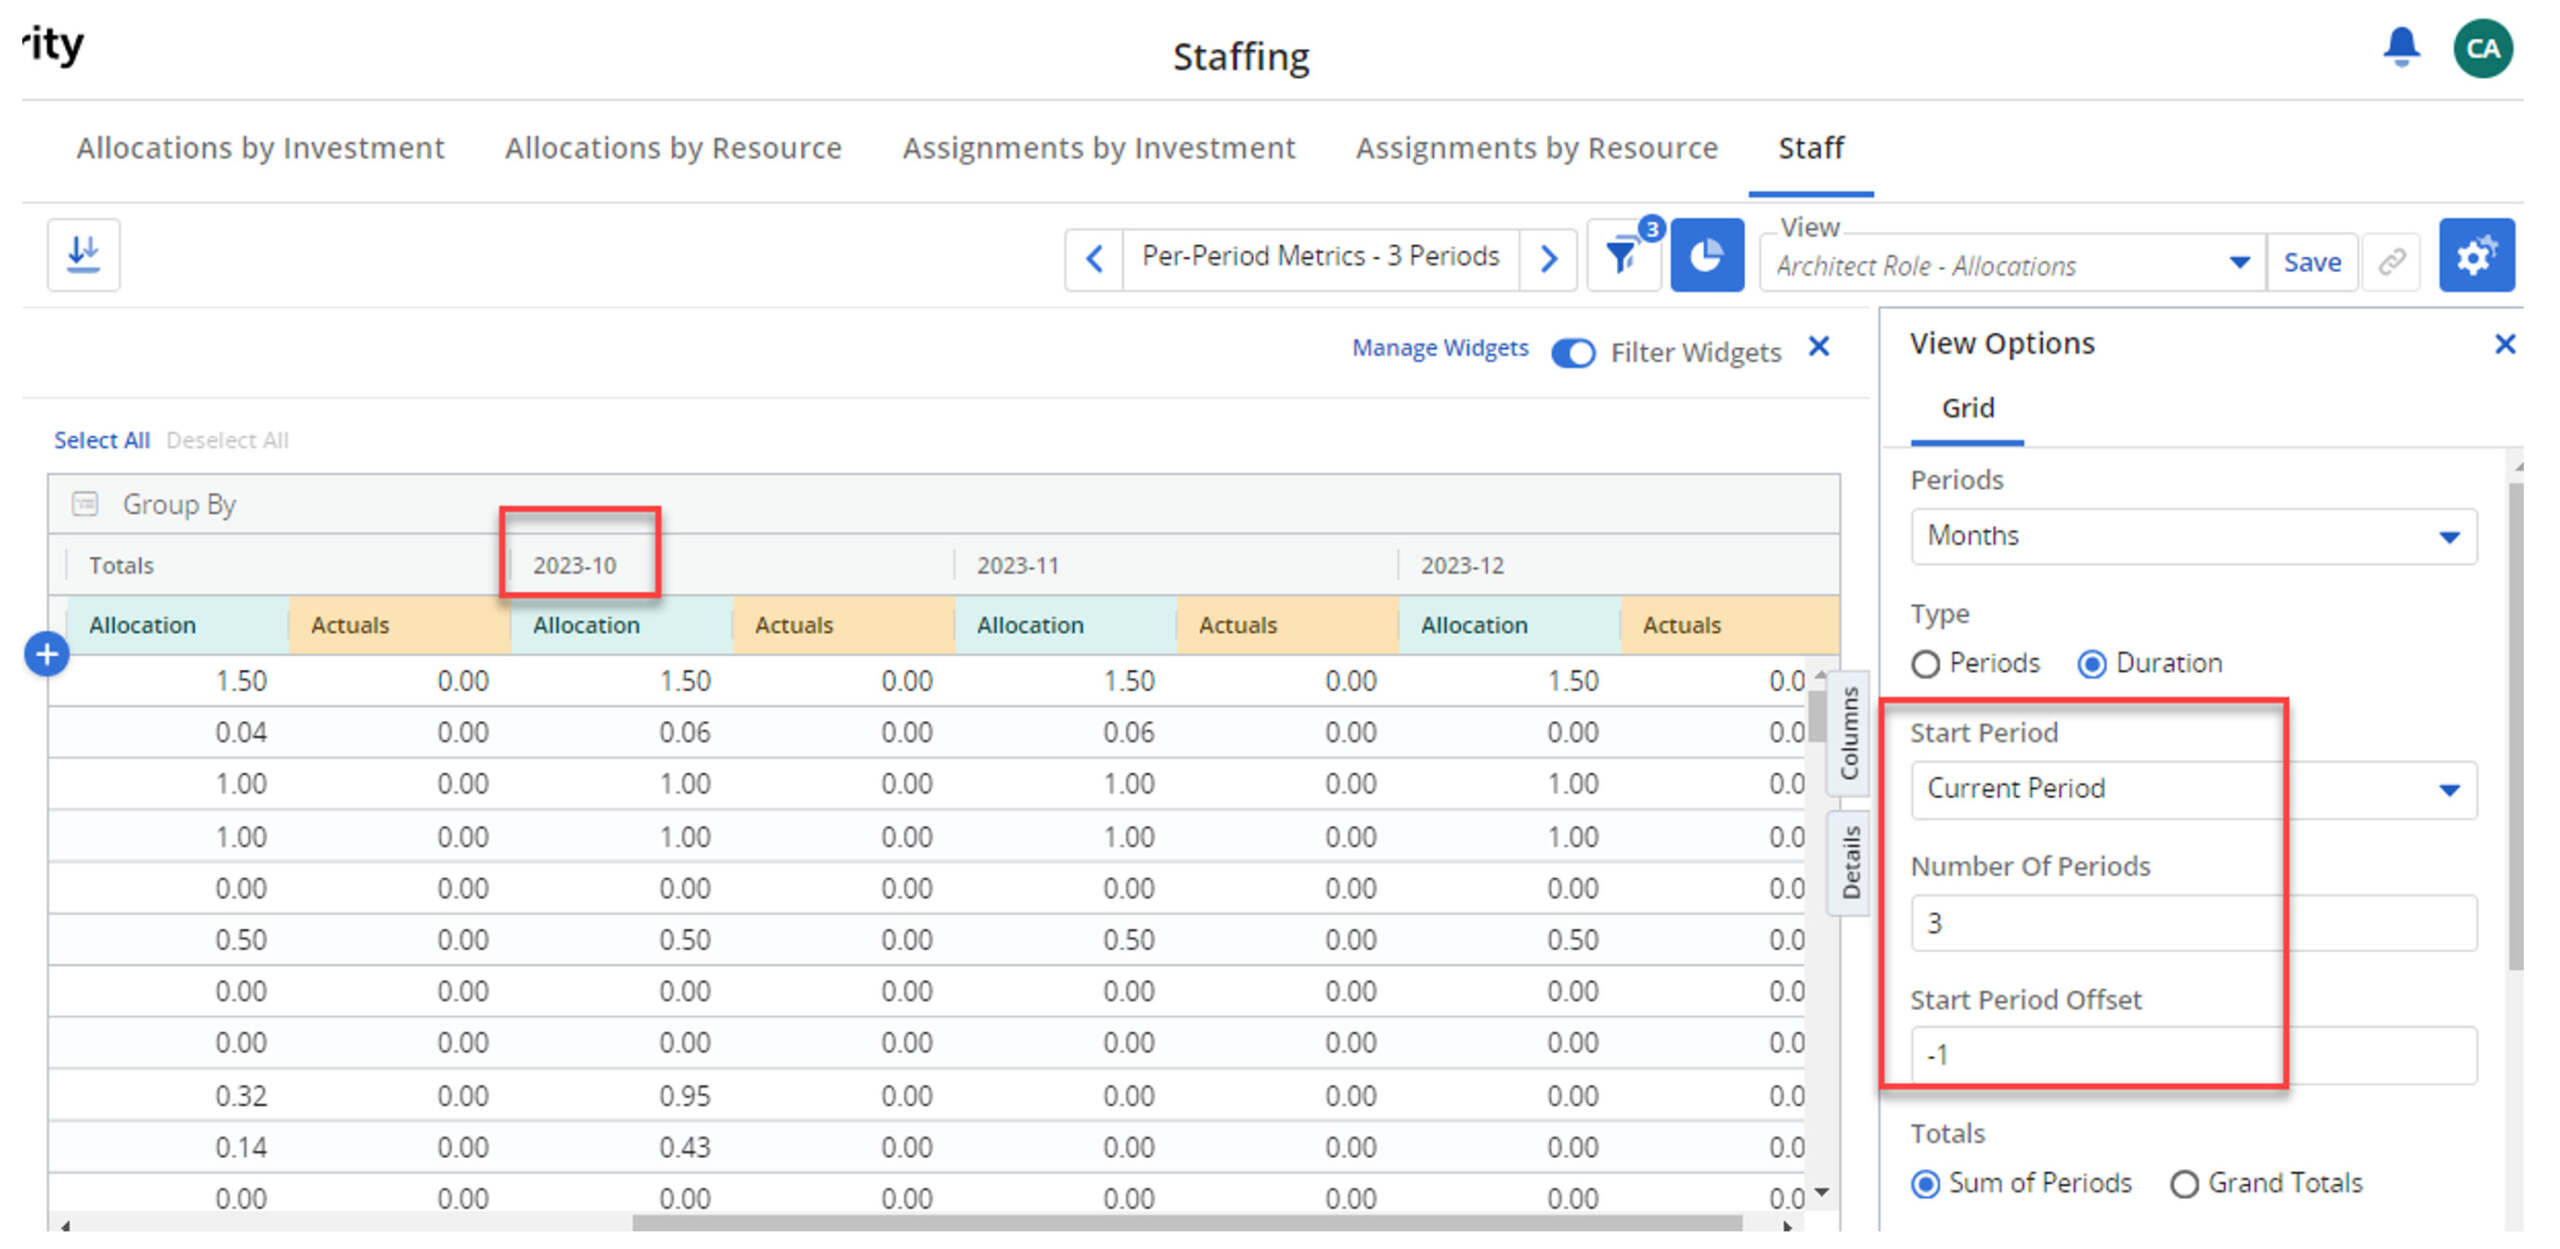
There’s also a new feature to offset the time periods you wish to view by using the Start Period Offset function. When using this, the system will recognize which start period you have specified and will then always move forward or backward, depending on the number you have entered here.
Note that you can enter a negative value if you wish. The best example I can recommend for the use of this feature is if you wish to view resource actuals in the context of allocations. Below, you can see we have selected a Start Period of the Current Month, but we have set an offset value of -1. This means our view will always go back one extra month.
And because actuals are only really recorded for dates gone by, it’s useful to be able to specify that you wish to view this Actual data from the past but also display allocation data for the specified periods.
Again, once you save this view, you will notice your view will observe a rolling date format, and any data displayed will be in relation to the current date.
Totals and Periods
Within View Options, you will also see a new set of radio buttons where you can choose between Total, Periods, and Total and Periods for your Per-Period Metrics.
If you select Total, you will see just the Total column for your metrics. Keep in mind that it will show the Sum of Periods or Grand Totals, as per your selection from the Totals section.

If you select the Periods button, you will only see the time-scale data for your chosen metrics.

If you select Total and Periods, you will see both your Total columns and your time-scale values.

New Staffing Tabs
Possibly, the most significant changes to the Staffing page in 16.1.3 are the additions that have been made to the tab structure on the page. You will now see five tabs available for selection, and you will see options for both Allocations and Assignments. The Staff Grid has also been renamed as simply Staff.

Allocations by Investment
In Clarity versions prior to 16.1.3, you would have been familiar with the Allocation Timeline tab. Within that tab, you had the option to display your data by Investment (with resources listed as a sub-level) or by Resource (with investments listed as the second layer). In 16.1.3, these groupings have now been separated out into tabs of their own.
In order to view Allocations by Investment, just click the tab of the same name.
Here, you will see a list of investments that you can expand to view your allocated resources.
One of the most significant features introduced here is the ability to Hide empty groups.
In version 16.1.2, the Allocation Timeline was opened to display all resources, regardless of whether they had allocations or if they fit within the filter date range. This approach definitely has benefits. However, this new feature allows you to cut through the noise and remove any rows from your filter results if there are no allocations applicable for your investments, resources, and date range.
In the example below, I have toggled off this feature, and you can see I have some rows returned that do not contain any allocation data. As mentioned above, this may be because they have allocations that are outside of the filter date range, or it may be because the resource is new to the organization and does not yet have any allocations.
You can easily identify which rows do not contain data, as they will not have icons to expand the investment row, as per the yellow highlight below.

Once the switch is toggled on, you will see the empty rows are removed from the view.

Allocations by Resource
Allocations by resource has also been separated out into its own tab. The data is in a format consistent with previous versions of the Allocation Timeline (i.e., you can view a list of resources and expand this detail to display investments where the resources are allocated).
Again, the big change here is that the Hide empty groups option is available. So, if you need to clear empty rows from your filter results, make sure this is toggled on.

Settings
Before we move onto the new Assignments tabs in the Staffing workspace, we need to discuss some of the new settings that are now available. In previous Clarity versions, you had the ability to set over/under thresholds for Allocations. From 16.1.3, you now have the capability to do the same for Assignments.
Simply click on your initial icon in the top right-hand corner and select Settings.

Click on the General tab and you will see that you can now set values for both Allocations and Assignments.

The default values for each are 30% under and 10% over, but you can edit these fields directly and update the thresholds to suit your organization.
The Allocation threshold remains unchanged, but it is important to understand how the new Assignment threshold is calculated.
The system will take into account the usage for the resource:
Actuals + ETC = Total Usage
This Total Usage is then compared to the Resource Availability. The data on your Assignment staffing pages are then colored accordingly.

Assignments by Investment
The ability to manage Assignments across multiple Investments is new in version 16.1.3. The Assignments by Investment tab can be found on the Staffing page, alongside Allocations by Investment and Allocations by Resource.
Here, you are provided with the capability to add or remove resources from investments, as well as the ability to edit the ETC for individual resources.

In keeping with the format of the allocation pages, the assignments pages are broken down into the timeline in the top section and the resource histogram in the bottom half.

You may choose to view Actual, ETC, or Usage data on this page. The per period metrics can be selected from within View Options.
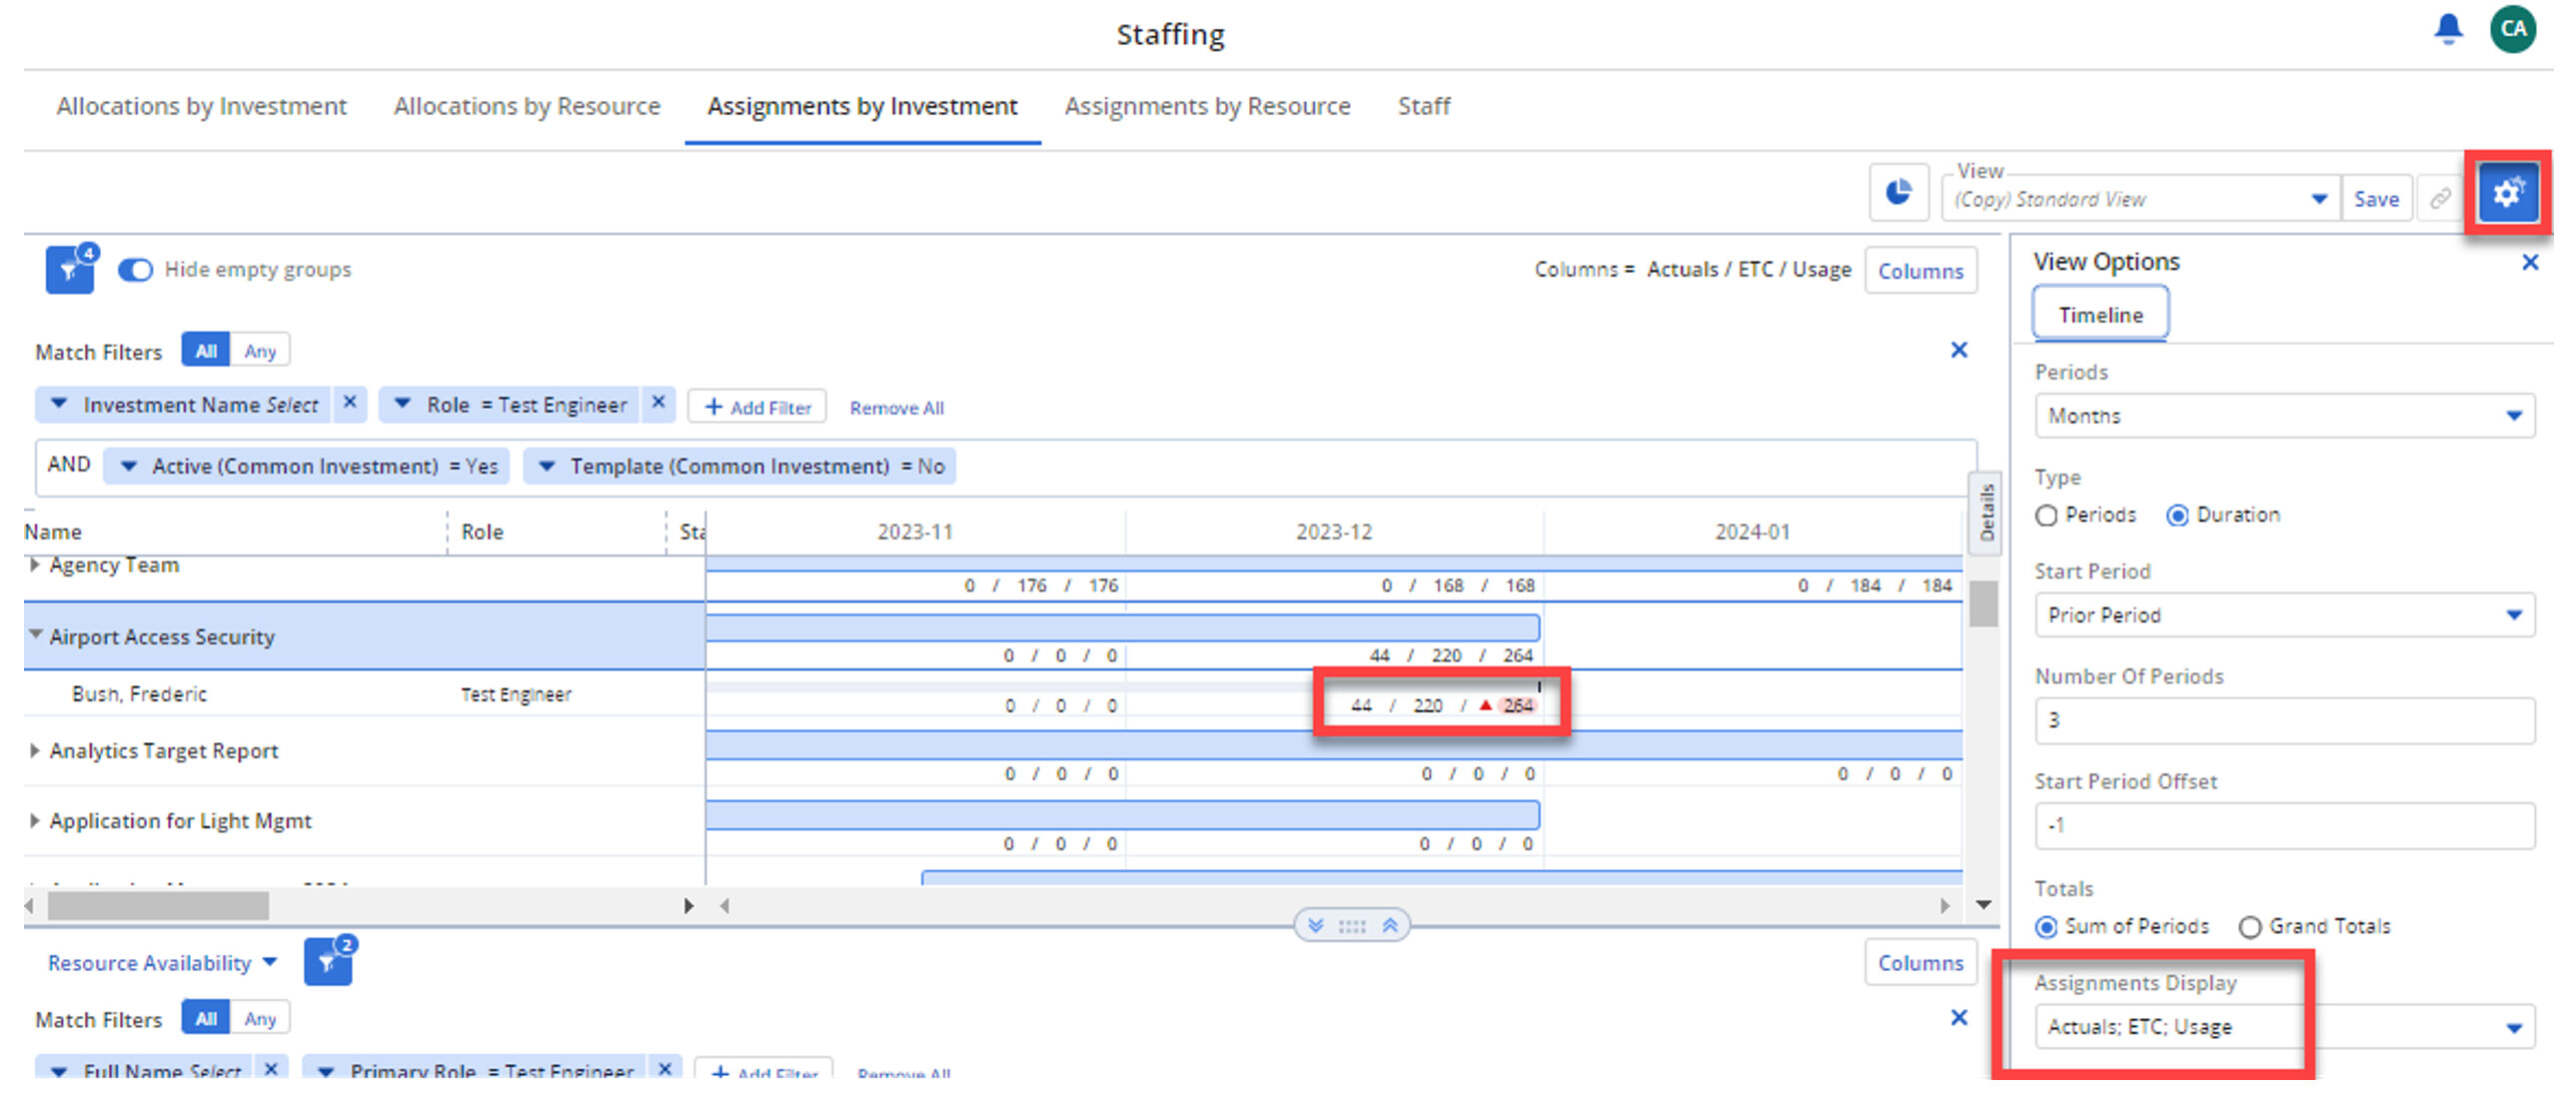
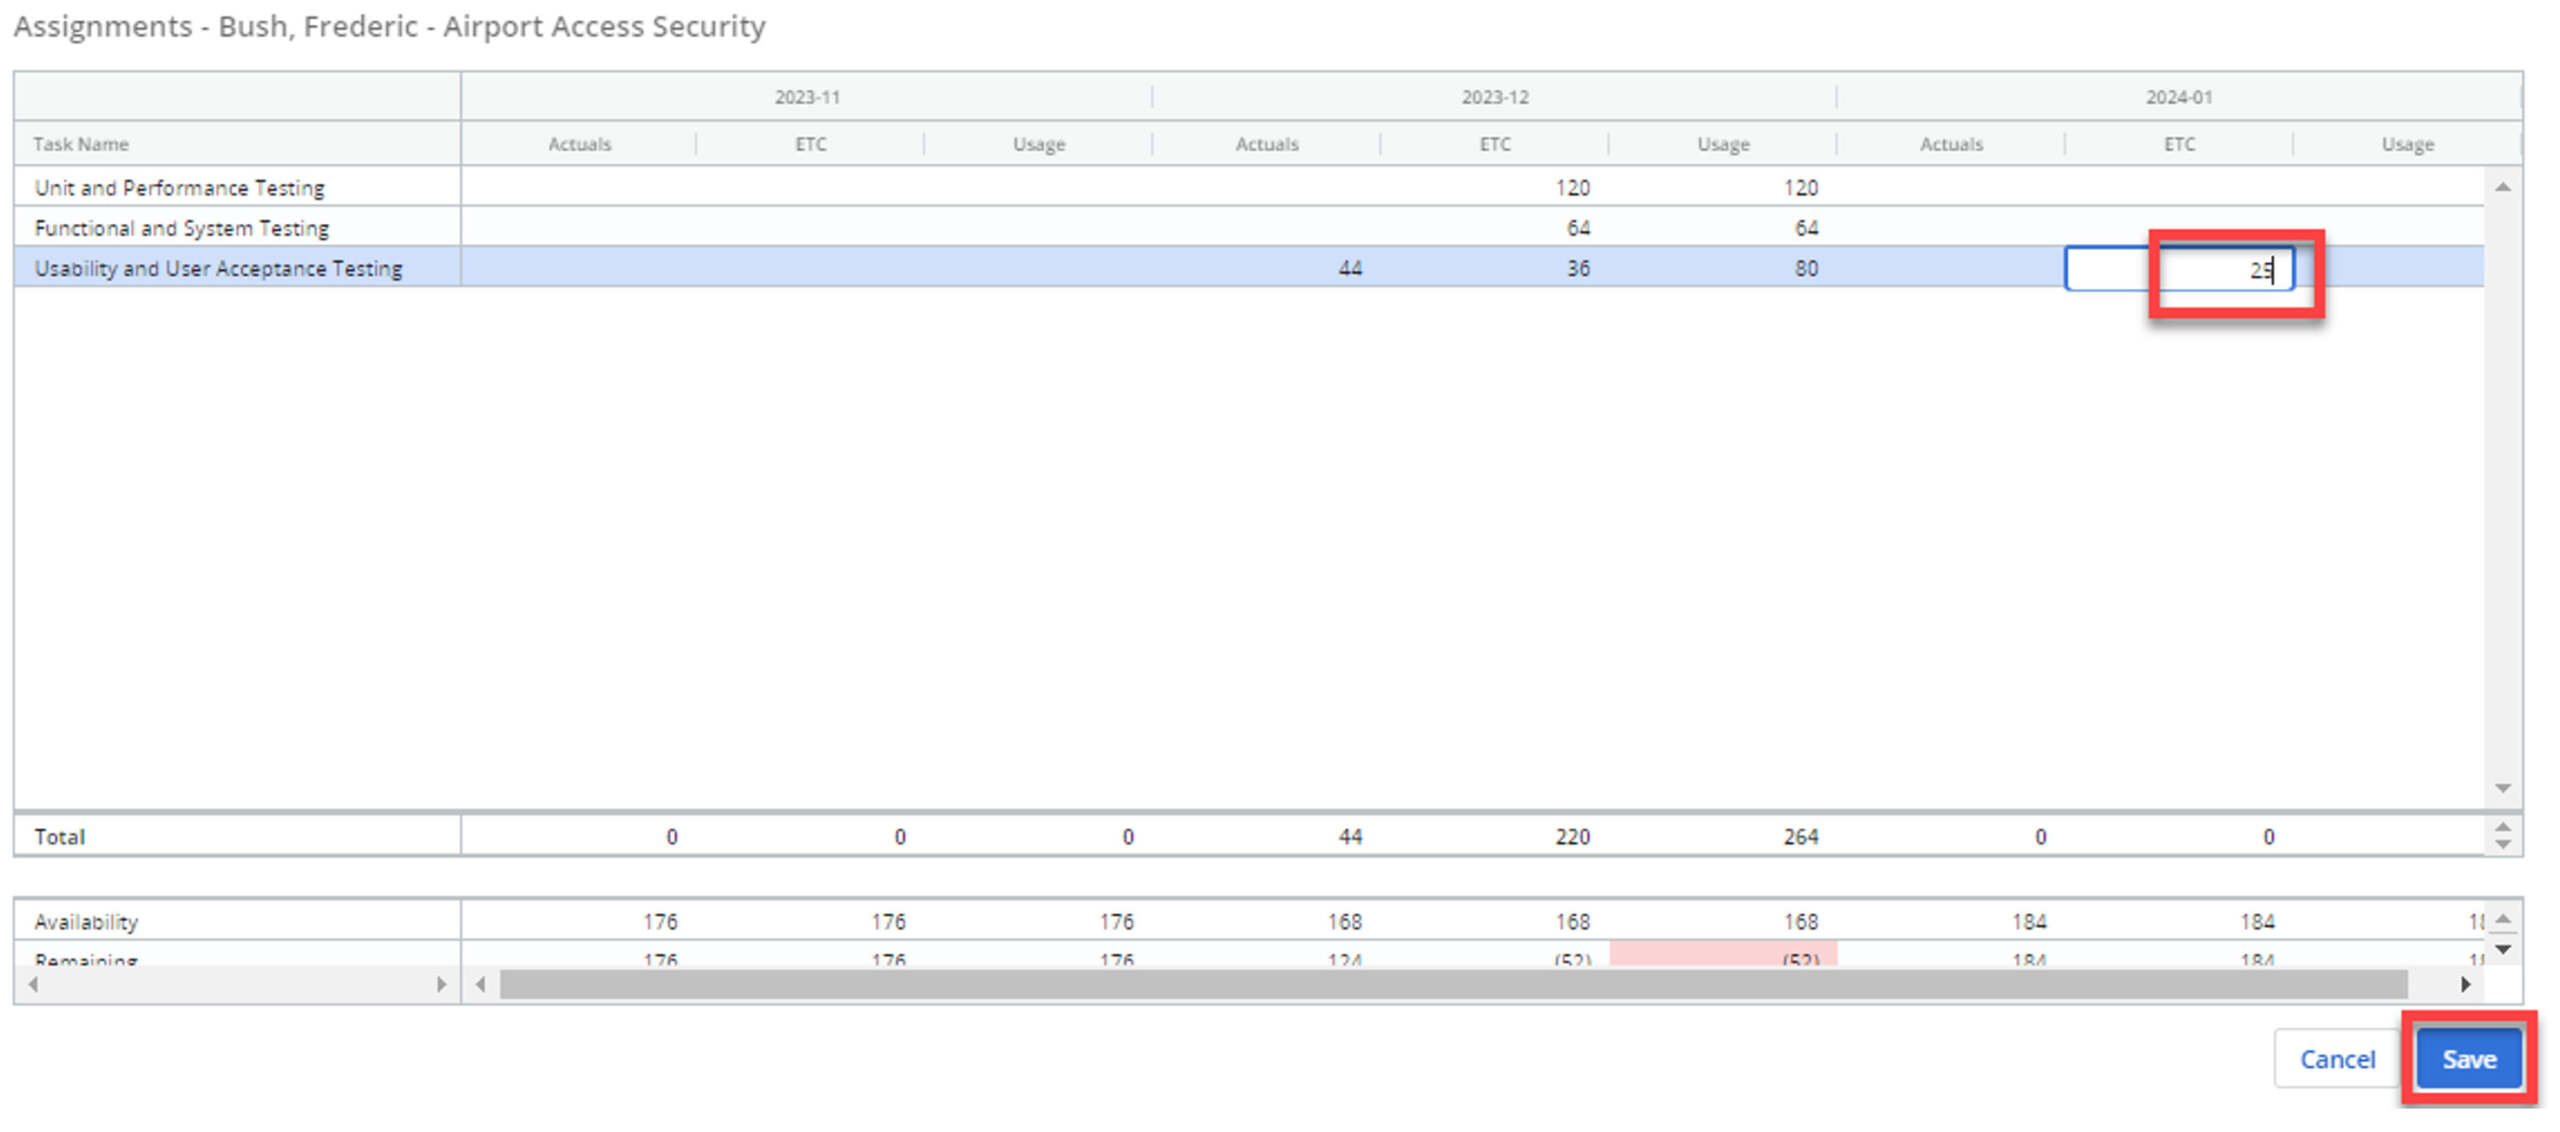
In order to edit ETC data, simply double-click on the timescale data to open the editing screen.
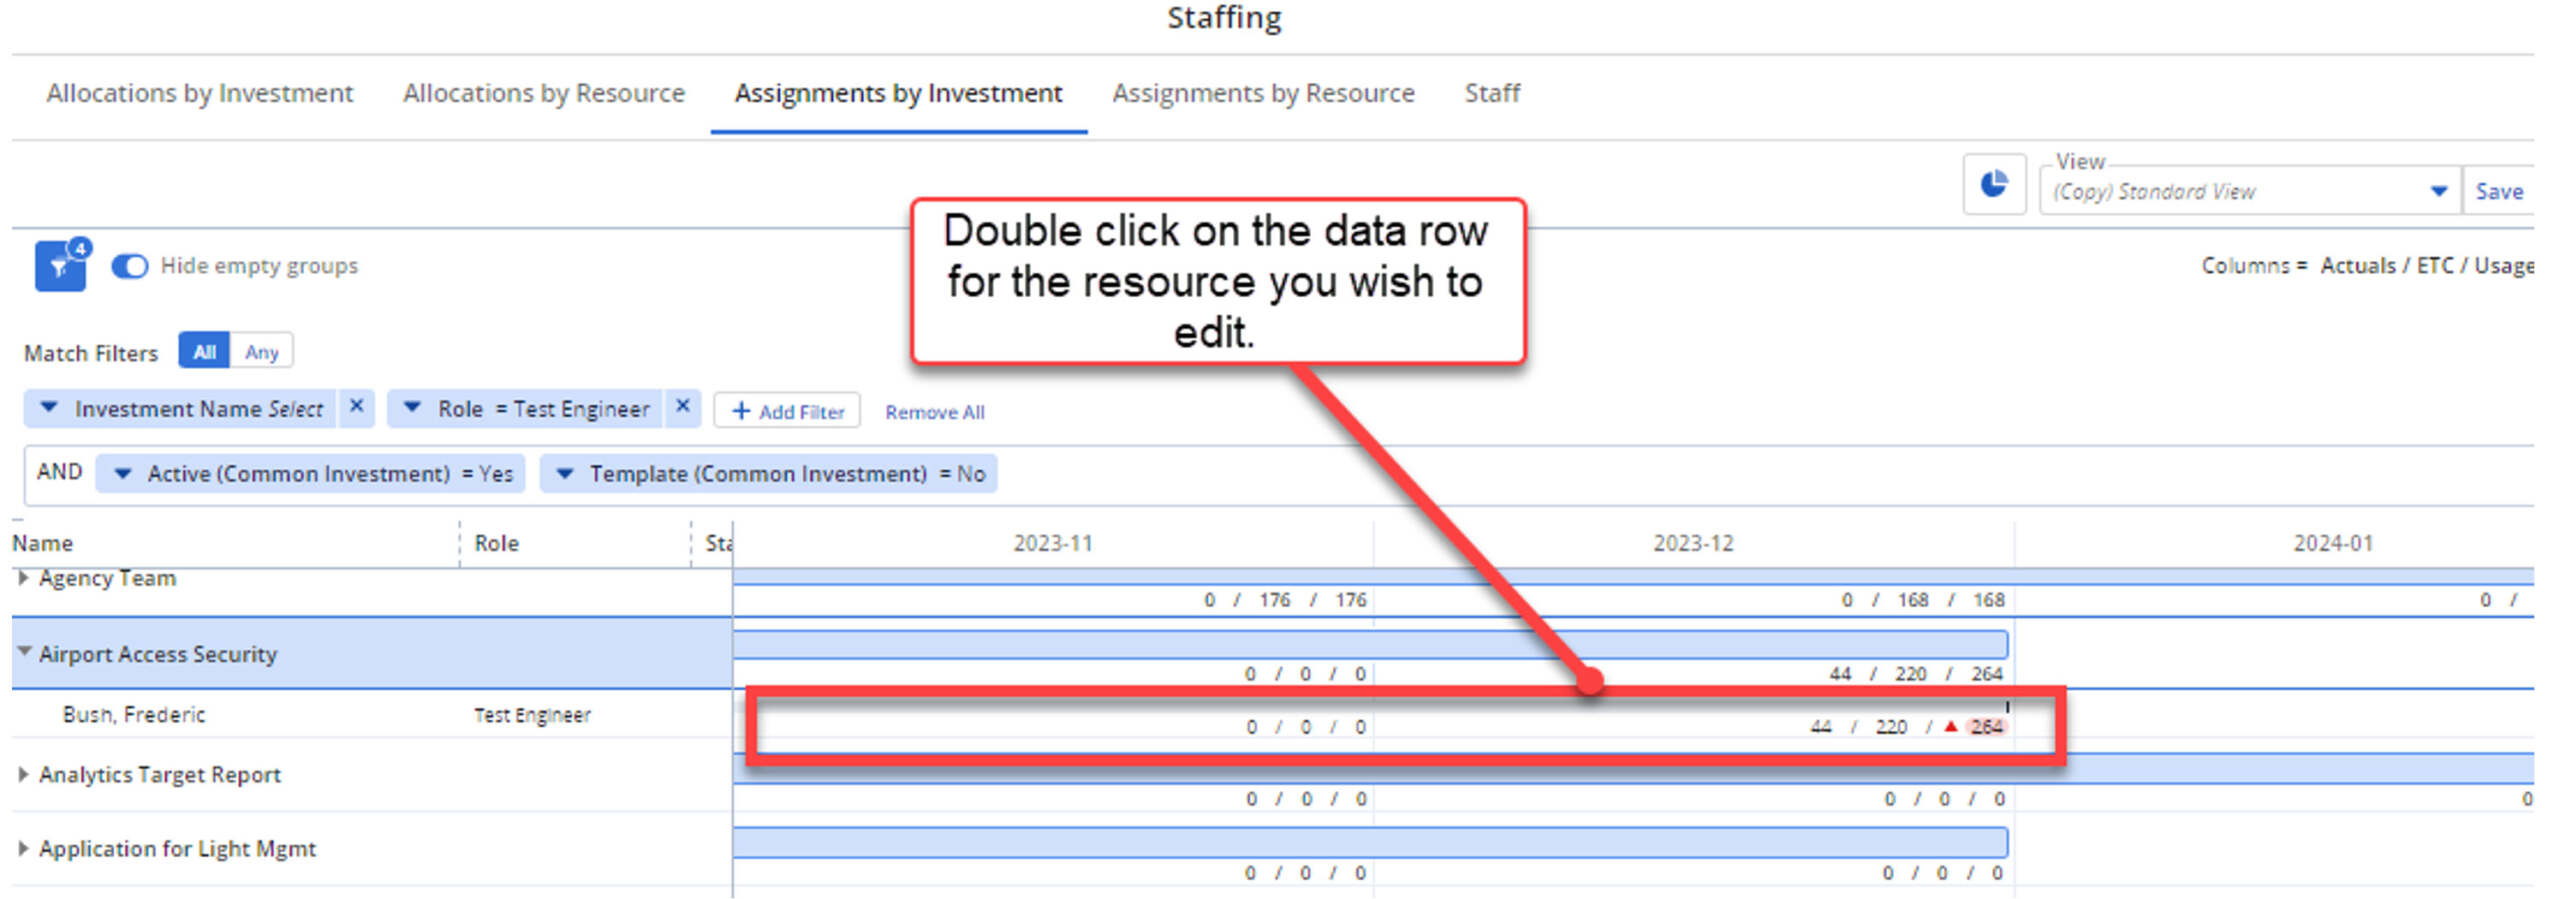
You will then see all tasks where the resource is assigned for this project. Edit the ETC values as required and click Save.
You can also right-click on the investment name and add staff (which will actually create a new allocation on the project).

And if you right-click on the resource or role, you can choose between further actions.

If you wish to assign a new resource to a task, you can search for them via the Resource Histogram and can drag and drop them onto the investment.

You will receive the following prompt where you can click Add.

This will create the necessary Allocation for the resource (on this new investment) and will then allow you to easily update the ETC for the resource on the required task.
It’s important to note that when you edit the ETC of a task, it may cause a change to the task dates in order to incorporate the new ETC values.

When viewing the resource histogram, the data that is displayed will always show you Total Usage as compared to Availability, regardless of the filter options that are selected for the timeline above.

If you find that your filter options are providing you with rows where no data is displayed…

…make sure you toggle on the Hide empty groups option to remove these rows.

Assignments By Resource
The Assignments by Resource tab functions in a way very similar to the Assignments by Investment tab. However, this page provides a resource-centric view. For each resource that matches your filter results, you can drill down to a list of investments where the resource has been allocated. From here, you may edit the resource task assignments.
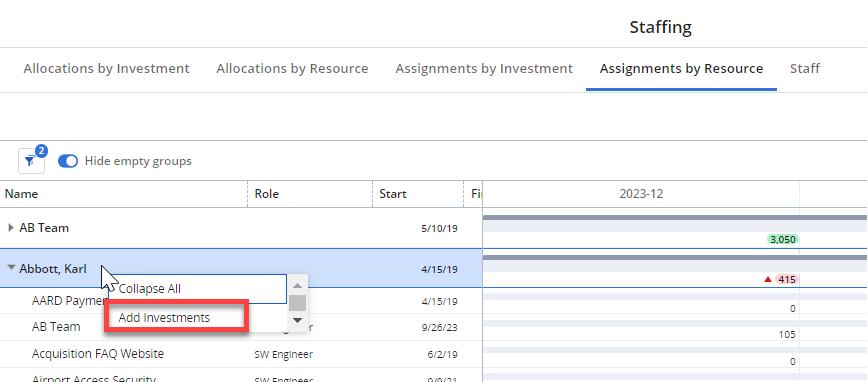
Right-clicking on the resource name will provide you with options to create allocations for the resource via the Add Investments option.
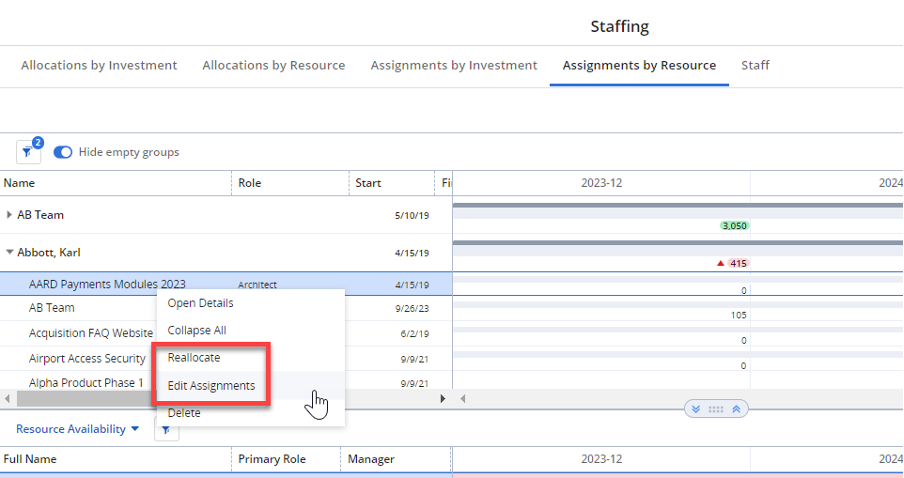
Right-clicking on the investment name will allow you to adjust existing allocations via the Reallocate option and will also allow you to drill down to the task assignments via Edit Assignments.
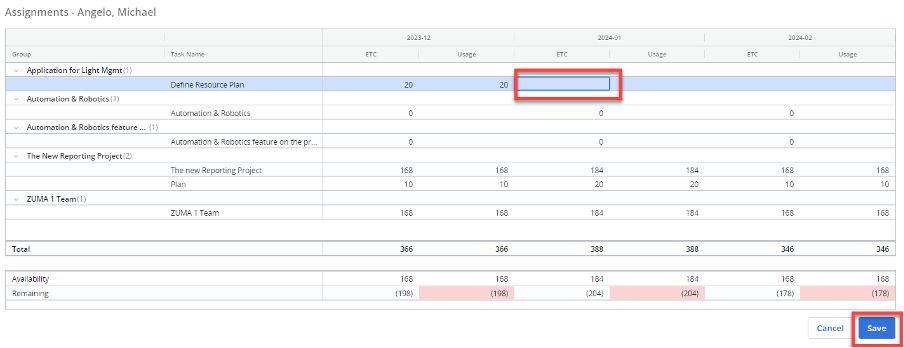
There is also a unique feature available from this screen where you can double-click on the time-period data to display editable ETC data across multiple projects. Just make sure you do this on the resource row instead of the investment row.

Once you have double-clicked, you will see rows for each investment where the selected resource has task assignments. It’s then simply a matter of editing the ETC data and clicking Save.
There are no additional access rights required to utilize the above features. So, if your resource managers are already using the Staffing workspace, then the new tabs and layout will be available to them from 16.1.3.

Rego Can Help
If your organization is interested in learning more about Clarity’s staffing capabilities, as well as resource management best practices, Rego can guide you.
Our experienced practitioners have used their Strategic Portfolio Management and Project Portfolio Management job expertise to guide clients to maximize the value of their SPM software.
To learn more, contact us or reach out to your Rego Account Manager.


