 Every company needs to solve the mystery of what’s driving their costs. For example, auto manufacturers strive to determine what the costs are for making and supporting vehicles over their lifetimes. Purchasing teams, finance teams, manufacturing floor mangers, etc. all rigorously detail every expense related to producing one vehicle. From tires, bolts, upholstery to all those working on the assembly line, marketing, sales, and more, auto manufacturers have exceled at tracking every cost associated with producing one vehicle. However, a new challenge has arisen in the auto industry— determining the IT support costs for a vehicle over its lifetime.
Remote start, driving directions, Alexa, Apple play, Google Play, and all other car applications features require Cloud support. So how much does something like remote start cost to support?
Problems like these are why it’s important for emerging FinOps groups to organize their company’s Cloud spend.
How Cloudability Enables Teams to Organize Their Cloud Spend
When a bill comes from a Cloud Service Provider, it comes in two forms. There is one bill with the overall cost of an organization’s cloud usage and another detailed bill in the form of a CSV with thousands, if not millions, of rows of data.
Sifting through all that data would take several days every month to determine where costs are coming from and supporting. For auto manufactures, it’d take hours to find every charge in these files for things like remote start and GPS location services. Situations like these is where Cloudability helps companies organize their Cloud spend.
Cloudability streamlines organizing Cloud Spend in 4 ways. It uses Tags & Labels, Account Groups, Business Mappings and Views to save companies hundreds of hours and dollars each year. The solution supports reporting and data visualization so that key stakeholders will be able to quickly understand their Cloud spend and make informed decisions.
Organizing Cloud Spend with Cloudability
Cloudability has 4 ways to organize a company’s Cloud spend:
- Tags & Labels
- Account Groups
- Business Mappings
- Views
Through these four methods, companies can determine their Total Cost of Ownership for their products/applications, create Unit Economics metrics with their Cloud spend, and track their biggest costs drivers in the Cloud.
Utilizing these 4 tools sets up companies for success in organizing their Cloud spend. Below, are examples of when these 4 features are essential for organizing a company’s Cloud spend.
Cloudability Tags & Labels
 Every Cloud Service Provider enables users to publish tags (or labels) to their detailed billing files. For example, on AWS an engineer can create an “environment” tag where they can note what environment each and every resource belongs to for their development teams.
For auto manufactures, many have thought about developing a way to order food or purchase other products using the car’s infotainment system. Developers need multiple Cloud environments to support the development and customer usage of features like these. Using tags like “environment” helps determine how much these features are costing to develop and how much it costs to support them.
However, one problem arises with tags and labels because teams can make label tags whatever they want. They can even make different variations of tags that mean the same thing. For example, teams could make tags like “env”, “enviro”, “ambiente”, etc. This is where Cloudability’s feature “Tags & Labels” helps organize all the tag variations into one common phrase.
In Cloudability’s Tags & Labels, users can create their own tag buckets. In the case described above, a FinOps team could make one “environment” bucket that gathers all the variations of the environment tag that exists.
Cloudability supports up to 30 different tag buckets and all of them can be used in reports, dashboards, and filters across Cloudability. The solution also keeps a record of every single tag that has been published in the Cloud billing file. Cloudability tracks which tags variations are being used so that organizations can drive teams to move from ill formatted tags to a standard set.
Cloudability Account Groups
Every Cloud Service Provider only publishes 2 pieces of data about an account (subscription / project)— the account name and account number. With only those two pieces of information, it’s hard for FinOps teams to track details like who owns the account, what department does an account belong in, what product does the account support, and so on.
Cloudability’s feature Account Groups allows teams to append information to these accounts. Account Groups can be used to track account owners, departments, projects, products, and whatever else is important for a company to know about an account. Using Account Groups, the FinOps teams can detail what accounts are being used for and help determine value-driven actions to take on the accounts.
Cloudability Business Mappings
Business Mappings are a series of “IF” statements with conditions that help FinOps teams organize their data. Each statement represents a set of conditions that help sort whether a cost should belong to one bucket or another.
There are 2 problems that business mappings help FinOps address when organizing Cloud spend— Cleaning up errors and creating custom cost buckets.
Cleaning up Errors
How many ways are there to write that something in a part of a production environment? Users could put all types of values like “Production”, “PRD”, and “Prod” that all mean the same environment. Business Mapping helps FinOps groups clean up these discrepancies and create one normalized set of terms.
For example, a Business Mapping can be a statement like:
If the environment tag has the value Production, PRD, and Prod, return Production instead
Using this clean up method enables FinOps team to make curated reports and dashboards that cater directly to the stakeholders who need to make timely, important decisions.
Creating Custom Cost Buckets
When organizations experience change, departments can get moved around, applications can become part of new products, teams can be renamed, and more. When these changes occur, the way the Cloud resources are organized don’t always reflect those changes quickly. Cloudability enables FinOps to take key pieces of data from the billing files and organize their own custom cost buckets.
For example, there could be a Business Mapping that organizes applications into products. A statement like this can be use in Cloudability:
If the Application tag equals 123, 555, or 321, then return Location Services
Using Business Mappings for this purpose will help FinOps organizations quickly adapt to changes so that timely and informed decisions can be made about Cloud spend.
Cloudability Views
Every stakeholder needs specific information to make key decisions. They need filtered information to quickly tell them what they need to know. In many cases, FinOps groups get bogged down producing specific reports and dashboards because everything needs to be filtered for specific stakeholders.
For example, if every team needs their own current month to date spend report, FinOps teams could spend hours creating dozens of variations of the same underlying report.
Here are a few of the teams that would need their own view to track their Cloud costs:
- procurement
- finance
- application DEV teams (one view for every team)
- the FinOps organization
- region presidents
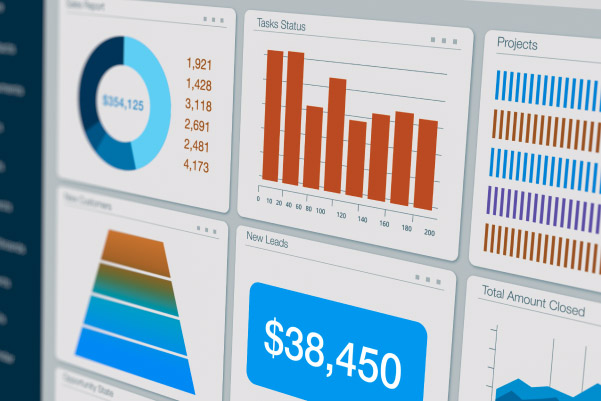 For example, let’s say one large company needed over 50 different views for their product teams. Their organization determined that each team needed 3 reports sent to them every month, and 2 dashboards to track their overall spend. Over 250 tailored reports and dashboards were needed to be made available.
This is where Cloudability Views makes reporting and dashboards scalable for large organizations. Cloudability Views enables users to create one report or one dashboard, and then apply a set of filters to the report for the specific end users. Instead of having to configure hundreds of reports and dashboards, FinOps teams only have to make one. Then users can choose the View they need to have to make informed decisions.
Views can be shared with the entire user base in Cloudability or just specific users. Views help save countless hours of time for FinOps groups when they are working to enable real-time decision making for stakeholders.
Every enterprise has a unique way of organizing their costs. By using Tags & Labels, Account Groups, Business Mappings, and Views in Cloudability, FinOps organizations can spend less time organizing Cloud spend and instead, help drive Cloud optimization for their companies.
If you are interested in learning more about how Cloudability can help your company organize their Cloud spend and improve their FinOps capabilities, contact us for a no-pressure conversation.
Let Rego Be Your Guide
Our Apptio consultants are senior-level Apptio users, experienced TBM strategists, PPM (Project Portfolio Management) experts, and implementation specialists. One thing that sets us apart from other consulting organizations is that we do not have designated entry- or junior-level associates. Every TBM consultant has over five years of experience working with Apptio and Fortune 20 and Fortune 100 companies.
We can help with technical configuration as well as implementation, adoption, and roadmap challenges. With our proven Agile approach, we deliver results you can see – fast – while reducing time-to-value.
Rego offers webinars, half-day training classes, and white papers. For more information, see Managed Support for Apptio.

