Even seasoned users can benefit from these Clarity reporting tips
Reports created using Clarity are a great way to showcase the value of Clarity PPM and the value of the work in action. Reports are also good tools for forecasting, facilitating decision-making, and guiding executives. We interviewed a couple of our Clarity experts to discover helpful Clarity reporting tips.
The first section covers questions to ask yourself before configuring advanced or ad-hoc reports. These tips are for experienced Clarity users. We also included a helpful list of reporting Do’s and Don’ts for all users. Lastly, you’ll find a simple project report-building exercise for newer users.
Five Questions to Ask Yourself When Creating an Advanced Report
While Clarity makes it easy to create simple reports from templates or out-of-the-box (OOTB) tools, if you are creating unique or ad-hoc reports, you’ll want to think about where your data is coming from and how that source stores information. Understanding your data sources will help you create accurate and useful reports.
Here are five things to ask yourself as you create reports.
1 – Have you explored the latest version of Clarity reporting options before requesting a custom portlet?
If you have updated to a newer version of Clarity, you may find that the new version includes features that may not have been available in OOTB in the past. Before requesting a customized portlet or connector, see if the latest version includes that function. You can save a lot of time and effort by checking what your new version offers before requesting customized portlets.
2 – Data warehouse: Do you understand where your data comes from?
The Data Warehouse is a powerful tool that allows many to utilize volumes of information for reporting, forecasting, and sharing of data. However, if you do not understand the source of your data and where that data is coming from, your reports may not be as valuable as you hoped. If you are unsure where your information is coming from, ask someone who knows and/or consult with your Rego account manager for assistance.
3 – Are the data time periods compatible?
Some data may be stored in different time periods such as hours, days, weeks, or quarters. Some records may update 24/7, and others by work periods. To ensure that the data you are comparing is relevant, find a way to make sure their time frames match to produce the best results.
4 – Does your company employ business intelligence (BI) experts?
If you work within a large organization, you may already have access to BI or data experts. You may be able to save your energy by requesting data from these experts or by asking them to show you how to access the data you need using the tools you are already using. If you do not have access to a data specialist, we can certainly help you obtain the required data and reports.
5 – Do you understand what is in the domains?
Understanding domains can be complicated. While they are created to make it easier to access desired data from the Data Warehouse, you may not obtain desired results if you do not understand the domain content. Often domain permissions may be applied to block you from accessing restricted data, further increasing your challenges. If you do not fully understand the domains, you may not reach your desired outcomes. You may benefit from consulting with your internal Clarity specialist or your Rego Clarity expert.
Clarity Reporting Tip: When creating reports, will I break anything?
When experimenting with report building, you cannot “break” anything if you do not alter the original data source or change existing configurations. Of course, you could cause issues if you present incorrect data or conclusions. For this reason, we suggest you experiment using Clarity advanced reporting options if you are new to building custom reports.
Do’s and Don’ts when Creating Reports
Here is a short Do and Don’t list acquired from our Rego experts. Some of which you can find in our free training sessions. These tips will help you create better reports and help you share them in a more beneficial way.
Do:
- Identify the top question you want the report to answer
- Use the right tool for the job: Portlets, Advanced Reporting, Ad-hoc view, Jaspersoft, or other
- Utilize operationalized Excel reports, if applicable
- Use automation tools to create routine reports and for distribution
- Create unique dashboards for leadership
- Don’t overcomplicate reports and make them easy to understand
- Make sure that terms and titles of things are consistently used
Don’t:
- Allow recipients to “mess around” or manipulate your data
- Include too many columns of data which may muddle the point of the report
- Forget to protect your report by applying usage and access rules
- Share the same report to everyone, tailor it for specific audiences
- Create reports that don’t match information other teams may have access to
For beginners: How do I create a basic Project report?
If you are new to Clarity, you may be able to gain confidence in using the PPM software by creating a basic (and useful) Project report using the Advanced Reporting tools and Ad-hoc Editor. It is a way to practice reporting skills if you are new to reporting building.
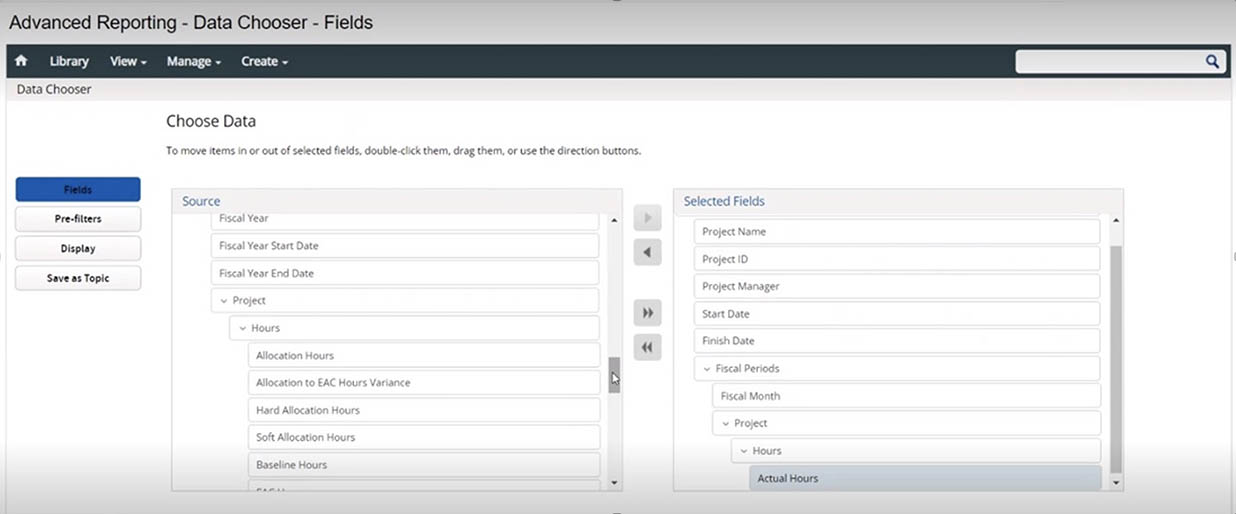
The screenshot shows the Advanced Reporting Data Chooser in Clarity.
- To begin, navigate to the “Organization and Access” section and select “OBS” (Organization Breakdown Structure).
- From there, select “Objects,” then “Select Data,” and then the domain “Project Management.”
- At this point, you will select “Choose Data” at the bottom of the domain list and will arrive at the “Advanced Reporting Data Chooser. Here you will select “Fields.”
- Select the Source “Projects.”
- Here you will be selecting the fields that will be included and compared within the report. Under “Projects,” choose “Project Name,” “Project ID,” “Project Manager,” “Start Date,” and “Finish Date.”
- Next, select “Financial,” and under “Financial,” choose “Fiscal Month,” and then under “Project,” select “Hours,” “Actual Hours,” and “ETC Hours.” ETC is an acronym for Estimate to Complete.
- After selecting the fields, you will be directed to “Advanced Reporting-Data Chooser-Fields.” Using the “Ad Hoc Editor,” you will build the report.
- For practice, mimic the columns and rows layout shown below.
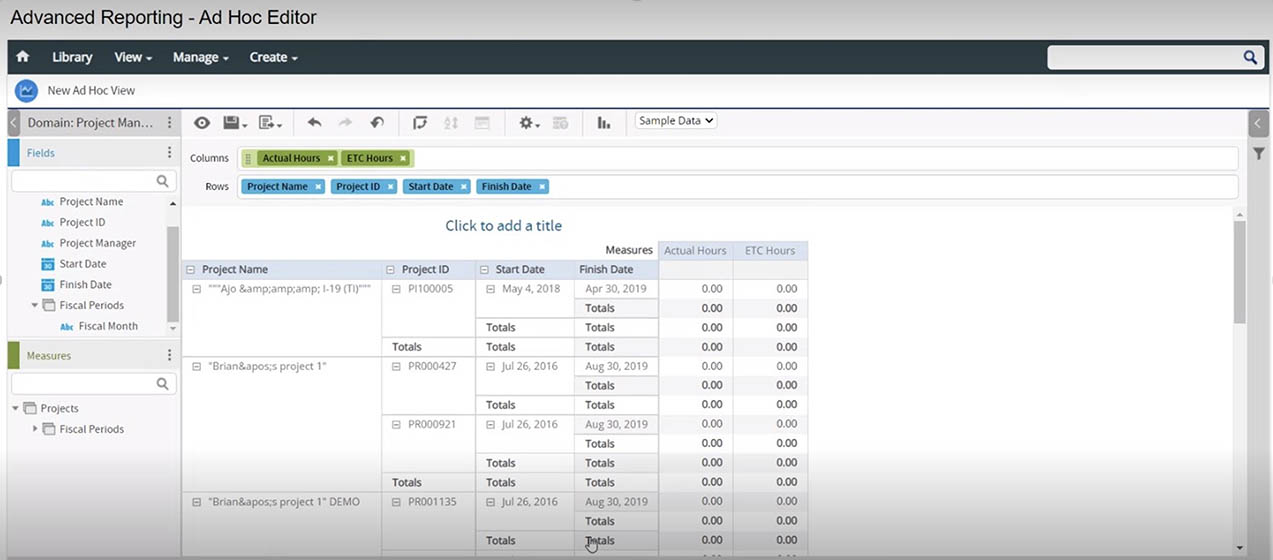
This is the Clarity Advanced Reporting Ad Hoc Editor.
If you need assistance with advanced reporting options or want to learn more Clarity reporting tips, reach out to your Rego guide for assistance.
What is the difference between Clarity’s advanced reporting and Jaspersoft?
You may notice that you often see Clarity and Jaspersoft mentioned together. Using Jaspersoft with Clarity, you can access data from multiple sources to create advanced reports.
If you use Clarity with Jaspersoft and want to learn more about automating reports, see Automate Report Bursting in Clarity PPM. The latest compatible versions are Clarity 15.9.1 or higher and Jaspersoft 7.8, or Clarity 15.9.1 and Jaspersoft 7.1.3.
If you need more information about Clarity reporting and integrating with Jaspersoft, contact your Rego guide.

Rego also offers free configuration and adoption assessments, webinars, and half-day training classes for Clarity and Rally Software® on Roadmaps, Portfolio Management, Power BI, Scaled Agile, Jaspersoft.
For a full list of Clarity PPM services, visit regoconsulting.com.
