Microsoft’s Power BI is a reporting tool that adds quick value. Through its intuitive end user experience and powerful capabilities, Power BI is revolutionizing the way people turn data into stunning reports. Curious? See what Power BI can do with our list of 6 reasons Clarity PPM users are turning to Power BI.
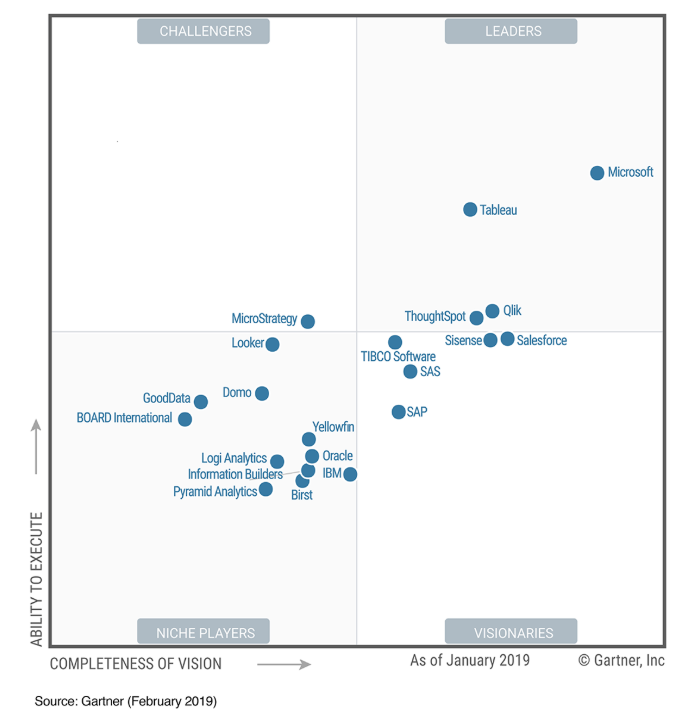
Chances are good that you’ve already heard about Microsoft’s Power BI. It’s been one of the top Analytics and BI Platforms for quite some time. It leads the pack as you can see from the below chart from Gartner.
Clarity PPM Portlets and Jaspersoft are great reporting platforms. So do Clarity users even need Power BI? We think there are six compelling reasons.
1) Microsoft’s Power BI Provides a True, Stunning Dashboard Experience
Power BI provides a true dashboard experience to end users with its feature-rich interactivity and analytics, and it comes with a very rich set of out-of-the-box visuals which are highly configurable. You can also use published custom visuals, or if you are tech savvy, create your own. Follow the link below to see some of the custom visuals.
2) The Same Power BI Report Can Connect with Multiple Data Sources
Power BI also allows you to connect to a wide range of data sources in the same report. What this means is that you can fetch data from Clarity, ServiceNow, and other data sources, and provide a holistic view of your organization’s data.
Many executives are asking for Clarity reports in Power BI because they have either seen the demo or have used Power BI report in other parts of the organization. You, too, can up the game.
3) Microsoft’s Power BI Only Needs Data and a Desktop
What do you need to get started with Power BI? The answer is simple: Power BI desktop and data.
Really, that is all that you need to start exploring the tool. And the added bonus is that you don’t need to spend a single dollar at this point.
Power BI desktop is a free desktop-based tool for connecting to data sources, transforming data, and creating interactive reports. Your data source can take multiple forms, including Excel, csv, ODATA, Oracle, SQL Server, and Power BI Datasets. The list is extensive.
Once you are convinced that this is the right tool for you, check with your IT/BI team on how you can get access to Power BI Service. This is a SaaS application that organizations use to share, collaborate, and administer Power BI contents. Because Power BI is so popular, chances are that the set-up is ready and already being used in your organization. It’s a single platform, so you can get started with the same set-up.
4) It’s Simple to Get Started with Power BI
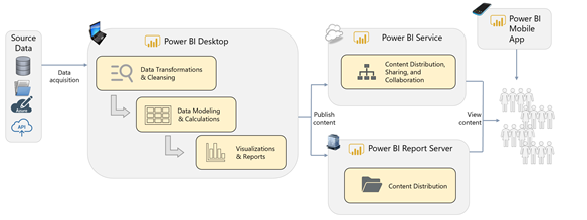
Microsoft’s diagram below illustrates the architecture of the platform. Power BI Report Server is an on-premise alternative for Power BI Service. There’s also a Power BI mobile app that you can download for free. Power BI desktop allows you to create a mobile-specific layout of your report—another nice feature.
Enough tech talk, let’s get started by exploring the tool.
Step 1: Download Microsoft’s Power BI desktop here.
Don’t forget to install it.
Step 2: Get data. The easiest way to get data from Clarity is to download data into Excel or csv from list pages (projects and resources, for example), Portlets, or Jasper Reports. The other, more formal, options are to get data using ODATA (available for Clarity on-demand customers) or from the Clarity database directly. We talk about these options in detail in our Power BI webinars. You can watch them below.
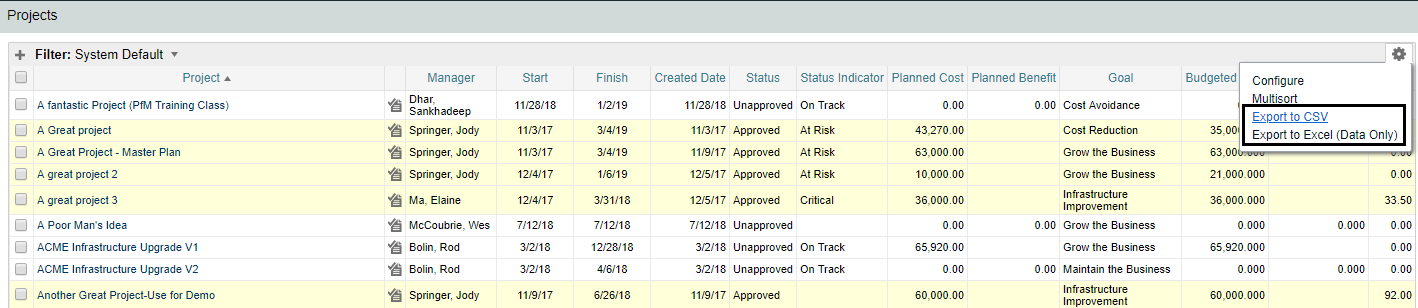
Here are some of the data download options from Clarity:
1. From project list page:
2. From a grid portlet: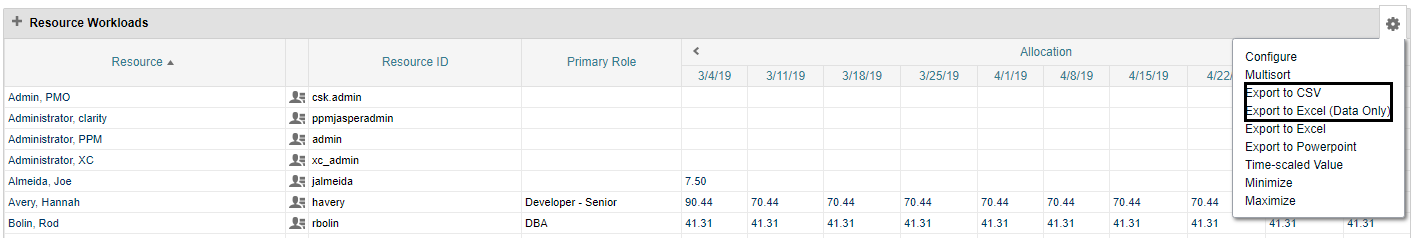
3. From Clarity Charts:
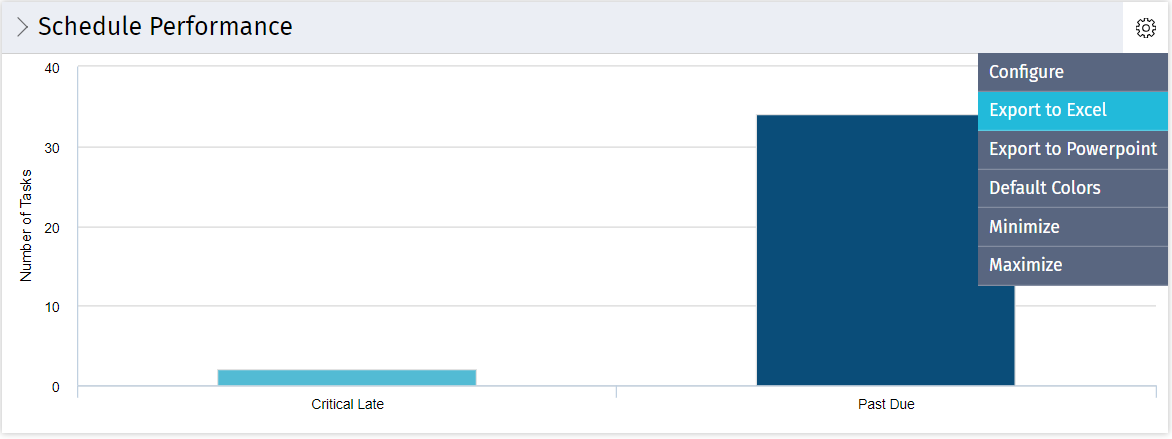
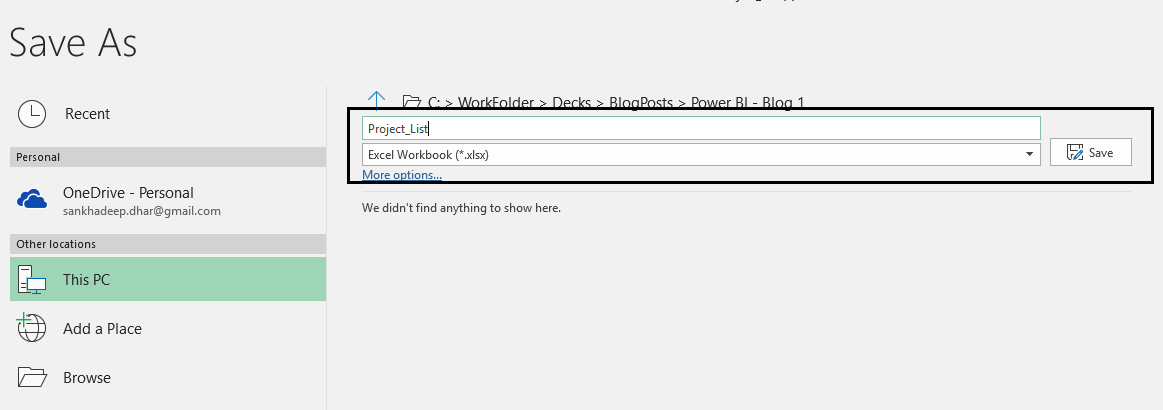
If you downloaded data from Clarity as an Excel file, please remember to open the downloaded file in MS Excel and save it as .xlsx or xls. This is an important because the actual data of the download file is of type xml. You don’t have to do this step if you download the files to csv or from Jasper Reports.
Open Power BI desktop and from Get Data, select Excel.
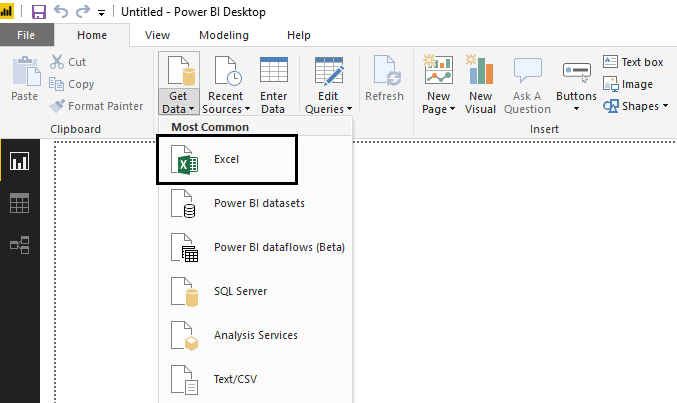
Point to the Excel file, select the worksheet, and click Load. The steps are the same for csv except that you will select Text/csv option and you don’t need to select the worksheet.
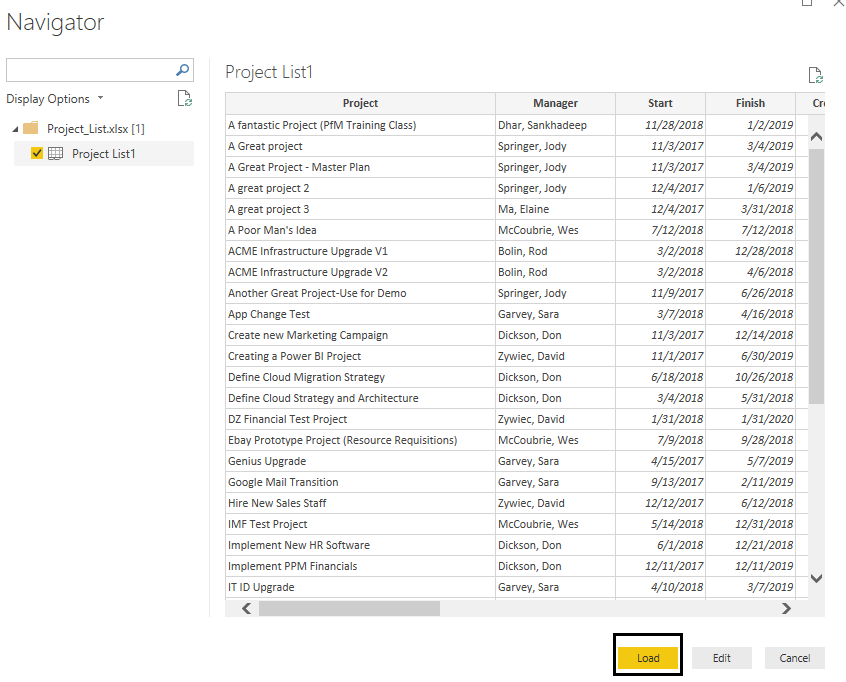
As you can see above, you can also preview the data before you load in to Power BI desktop. After the data is loaded, you will see the columns under the fields section.
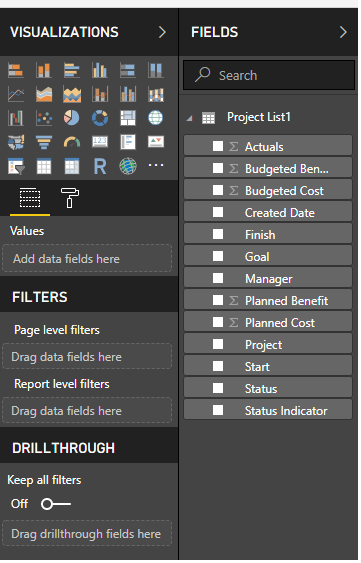
You can now start playing around with the visuals and dragging and dropping the columns to create some meaningful insights.
Check out the example below. It took about 15 minutes to build all the visuals with zero coding.
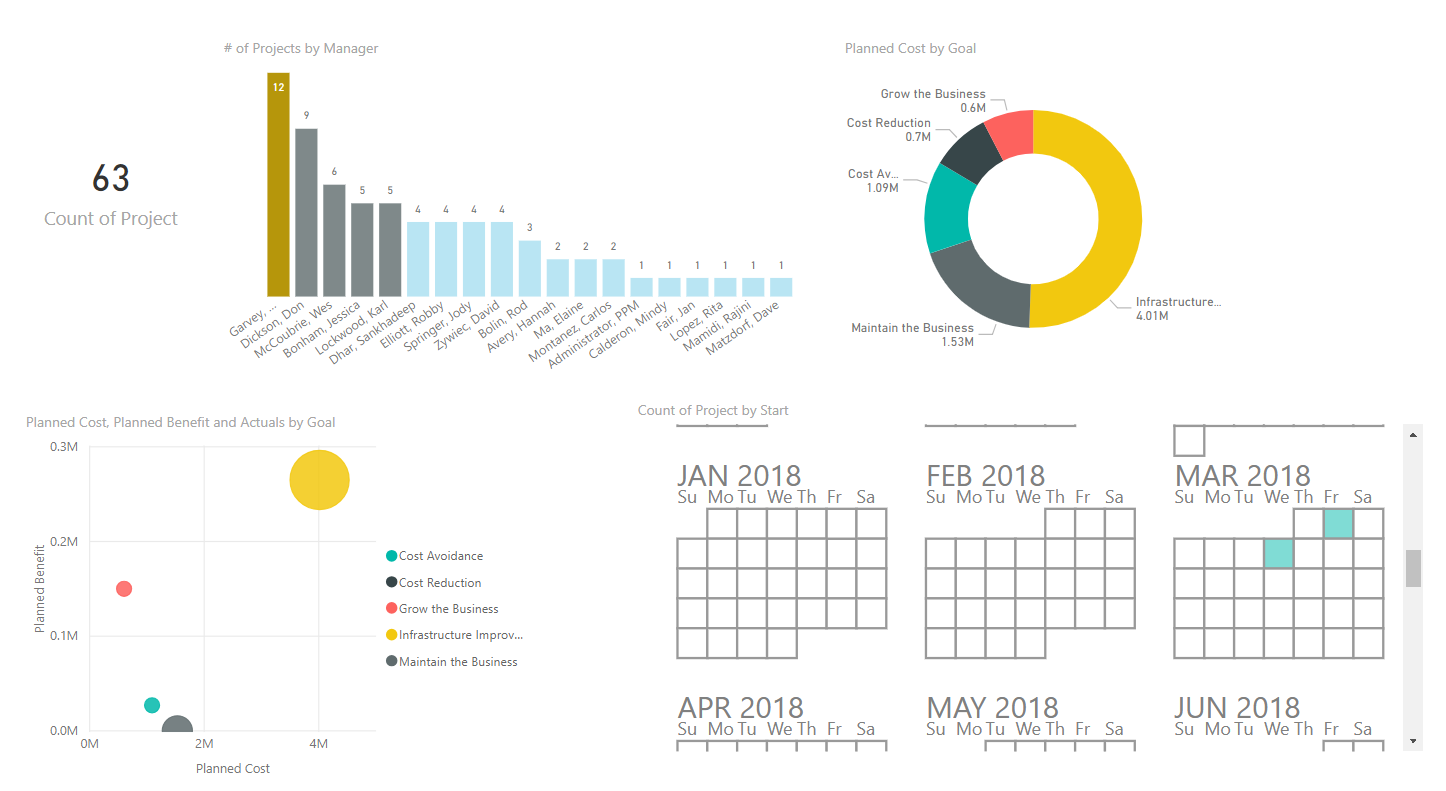
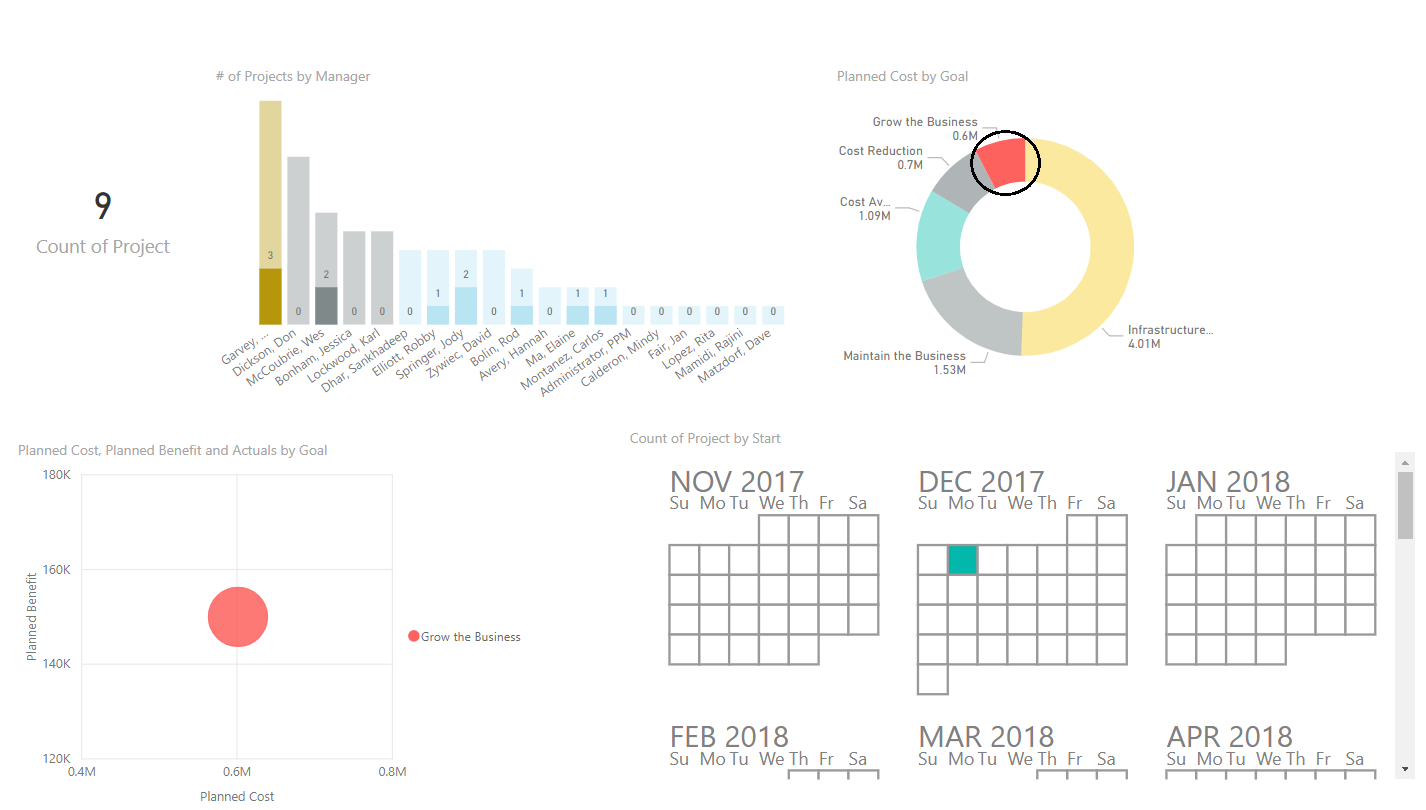
The visuals can interact with each other, too. For example, the user can filter for Grow the Business projects by clicking on the appropriate section of the Donut Chart. This interactivity is inherent to everything that you can build in Power BI, and you also have the option to configure it further.
5) Microsoft’s Power BI Facilitates Report Sharing
With Power BI, you can easily create stunning visuals to bring information to life and provide meaningful insights to your stakeholders. Imagine using such an interactive report with stunning visuals in a Project Review Meeting or a Budgeting discussion. In my subsequent blogs, we’ll talk about additional Power BI features.
 In order to share the report, you can upload the report to Power BI service (the recommended approach), or you can email the report file itself. Whoever is receiving the report file will need Power BI desktop to view the report. With Power BI service, all that your user would need is access to the internet, Power BI service, and the report.
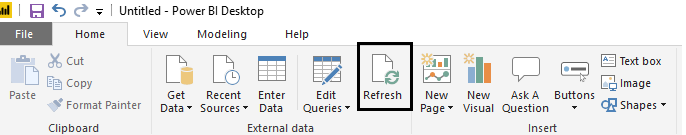
Now that you’ve created the report, it’s important to note that the data in the Excel file has been extracted into the Power BI report. If you need to refresh the data at some point, all you need to do is download the data once again into the same Excel file and from the Power BI report hit the Refresh Button. This is a manual process with Power BI desktop and can be automated from Power BI service.
6) You Can Embed Power BI Reports in Clarity
There are many other possibilities for using Power BI with Clarity PPM. For example, you can implement Row Level Security—which is data security based on a user’s access in Clarity—to embed Power BI Reports within Clarity pages and use additional data extract options from Clarity. Advanced formatting options also allow you to implement traffic lights in your Status Report data. We’ll cover these options and more in future blogs.
Rego helps clients create dashboards in Microsoft’s Power BI and also provides extensive, customer-specific training across many other Clarity PPM features. Please reach out to your Rego representative or contact us at info@regoconsulting.com to learn more.
Let Rego Be Your Guide
Rego would be delighted to show you how we can meet your Clarity consulting needs. Contact us for a free configuration and adoption assessment or demo today, and be sure to join our mailing list below.